| |

Linear ModelsLinear regression is one of the most comprehensive and frequently used regression techniques. It's one of the easiest regression techniques. The results are simple to interpret, one of its key benefits. The techniques for regression listed below assume that the target value will be a linear mixture of the attributes. If represents the anticipated value in mathematical language. y^(w,x)=w0+w1x1+......wpxp We assign the vector a name throughout the module. w=(w1,....,wp) as coef and w0 in the intercept_. See Logistic regression to do classification using generalised linear models. LinearRegression adapts a linear version using coefficients w=(w1,..., wp) so that the residual sum of squares between the dataset's targets and the dreams projected using the linear approximation can be reduced. It resolves a mathematical issue of the following type: minw||Xw-y||2 Linear Regression Example:The sample below uses only the first feature of the diabetes dataset to show the two-dimensional plot's data points. The graphic illustrates how linear regression seeks to create a straight line that best minimises the residual sum of squares between the dataset's observed responses and the predictions made by the linear approximation. The coefficients, residual sum of squares, and coefficient of dedication are also calculated. Output Coefficients: [938.23786125] Mean squared error: 2548.07 Coefficient of determination: 0.47 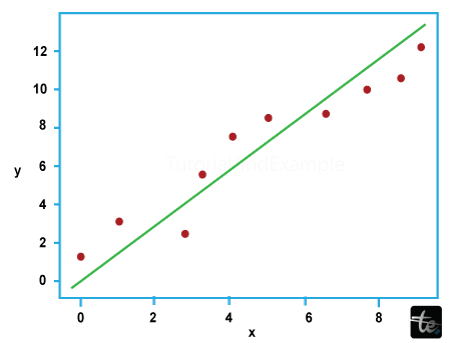
When functions are associated and the columns of the layout matrix exhibit an approximately linear relationship, the design matrix X approaches singularity. As a result, the least-squares estimate becomes significantly more susceptible to random mistakes within the found objective. Examples: Linear Regression Example Non-Negative Least SquaresIt is feasible to force all of the coefficients to be non-poor when they represent certain physical or obviously non-negative values, such as frequency counts or product charges. Examples: Less-than-zero least squares Simple linear regression is a strategy for predicting a response based on a single feature. This is one of the most basic system mastering models that a fan of the field can learn about. The dependent and independent variables are considered linearly connected in a linear regression. Therefore, given a feature or independent variable (x), we seek a linear function that accurately predicts the response value (y). Implementation of Python in Linear Regression:The Python programming language can be used to investigate the coefficients of linear regression models. We will employ the matplotlib library to plot the input data and best-fit line. It is among the most used Python packages for graphing. Output Estimated coefficients: b_0 = -0.0586206896552 b_1 = 1.45747126437 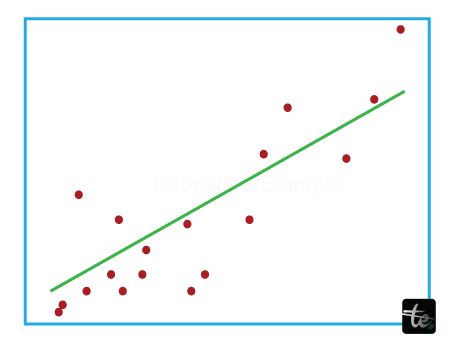
By fitting a linear equation to the observed data, linear regression is a widely used statistical technique in statistics analysis and system learning for modelling the relationship between a structured variable and one or more independent variables. It is a fundamental technique for gathering data and forecasting numerical outcomes. Finding the optimal straight line (or hyperplane in a couple of dimensions) that best captures the connection between the independent variables and the established variable is the main goal of linear regression. The price of a variable is predicted using a linear regression analysis based on the cost of all other variables. The based variable is the one you should be anticipating. The impartial variable is the one you're using to make a prediction about the value of the other variable. In order to as correctly predict the value of the based variable as possible, this method of evaluation makes an estimate of the coefficients of the linear equation for one or more goal variables. Conclusion:A crucial statistical technique used in data analysis and device learning is linear regression, which models the connection between a dependent variable and one or more independent variables. It provides a straightforward yet effective framework for gathering data, making predictions, and interpreting numerical outcomes.
Next TopicCycleGAN
|
 For Videos Join Our Youtube Channel: Join Now
Feedback
- Send your Feedback to [email protected]
Help Others, Please Share


