Confusion Matrix in Machine Learning
The confusion matrix is a matrix used to determine the performance of the classification models for a given set of test data. It can only be determined if the true values for test data are known. The matrix itself can be easily understood, but the related terminologies may be confusing. Since it shows the errors in the model performance in the form of a matrix, hence also known as an error matrix. Some features of Confusion matrix are given below:
- For the 2 prediction classes of classifiers, the matrix is of 2*2 table, for 3 classes, it is 3*3 table, and so on.
- The matrix is divided into two dimensions, that are predicted values and actual values along with the total number of predictions.
- Predicted values are those values, which are predicted by the model, and actual values are the true values for the given observations.
- It looks like the below table:
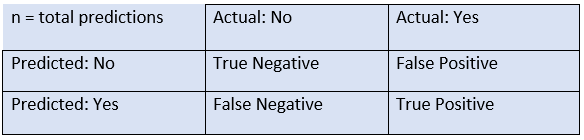
The above table has the following cases:
- True Negative: Model has given prediction No, and the real or actual value was also No.
- True Positive: The model has predicted yes, and the actual value was also true.
- False Negative: The model has predicted no, but the actual value was Yes, it is also called as Type-II error.
- False Positive: The model has predicted Yes, but the actual value was No. It is also called a Type-I error.
Need for Confusion Matrix in Machine learning
- It evaluates the performance of the classification models, when they make predictions on test data, and tells how good our classification model is.
- It not only tells the error made by the classifiers but also the type of errors such as it is either type-I or type-II error.
- With the help of the confusion matrix, we can calculate the different parameters for the model, such as accuracy, precision, etc.
Example: We can understand the confusion matrix using an example.
Suppose we are trying to create a model that can predict the result for the disease that is either a person has that disease or not. So, the confusion matrix for this is given as:
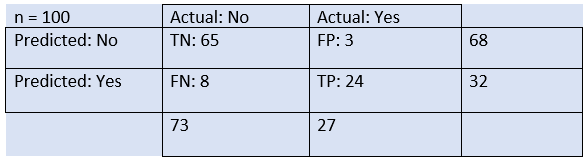
From the above example, we can conclude that:
- The table is given for the two-class classifier, which has two predictions "Yes" and "NO." Here, Yes defines that patient has the disease, and No defines that patient does not has that disease.
- The classifier has made a total of 100 predictions. Out of 100 predictions, 89 are true predictions, and 11 are incorrect predictions.
- The model has given prediction "yes" for 32 times, and "No" for 68 times. Whereas the actual "Yes" was 27, and actual "No" was 73 times.
Calculations using Confusion Matrix:
We can perform various calculations for the model, such as the model's accuracy, using this matrix. These calculations are given below:
- Classification Accuracy: It is one of the important parameters to determine the accuracy of the classification problems. It defines how often the model predicts the correct output. It can be calculated as the ratio of the number of correct predictions made by the classifier to all number of predictions made by the classifiers. The formula is given below:

- Misclassification rate: It is also termed as Error rate, and it defines how often the model gives the wrong predictions. The value of error rate can be calculated as the number of incorrect predictions to all number of the predictions made by the classifier. The formula is given below:

- Precision: It can be defined as the number of correct outputs provided by the model or out of all positive classes that have predicted correctly by the model, how many of them were actually true. It can be calculated using the below formula:

- Recall: It is defined as the out of total positive classes, how our model predicted correctly. The recall must be as high as possible.

- F-measure: If two models have low precision and high recall or vice versa, it is difficult to compare these models. So, for this purpose, we can use F-score. This score helps us to evaluate the recall and precision at the same time. The F-score is maximum if the recall is equal to the precision. It can be calculated using the below formula:

Other important terms used in Confusion Matrix:
- Null Error rate: It defines how often our model would be incorrect if it always predicted the majority class. As per the accuracy paradox, it is said that "the best classifier has a higher error rate than the null error rate."
- ROC Curve: The ROC is a graph displaying a classifier's performance for all possible thresholds. The graph is plotted between the true positive rate (on the Y-axis) and the false Positive rate (on the x-axis).
|

 For Videos Join Our Youtube Channel: Join Now


