Insurance Fraud Detection -Machine Learning
Insurance companies face a serious problem with insurance fraud, which costs them billions of dollars every year. There are several ways that insurance fraud might appear, including fabricating or exaggerating claims. Here is where machine learning may be used to detect insurance fraud. Machine learning algorithms may be used to analyze large amounts of data to find trends that may indicate fraud. These real-time data processing methods allow insurance companies to quickly spot and prevent bogus claims. Many machine learning methods, including decision trees, random forests, logistic regression, and neural networks, can be used to detect insurance fraud. The choice of algorithm will rely on the particular needs of the application. Each of these algorithms has advantages and disadvantages. Benefits of Machine Learning for Fraud DetectionHere are some of the benefits of using machine learning for insurance fraud detection:
The data imbalance is a major problem in the identification of insurance fraud. Due to the relative rarity of fraudulent claims in comparison to valid claims, it might be challenging to develop a model that can reliably identify fraud. Techniques like oversampling, undersampling, and cost-sensitive learning can be used to balance the data and enhance the model's performance in order to solve this problem. Python ImplementationHere we will see various models that can be used for insurance fraud detection and their accuracy.
Output: 
The dataset contains 40 columns. Output: 
Output: 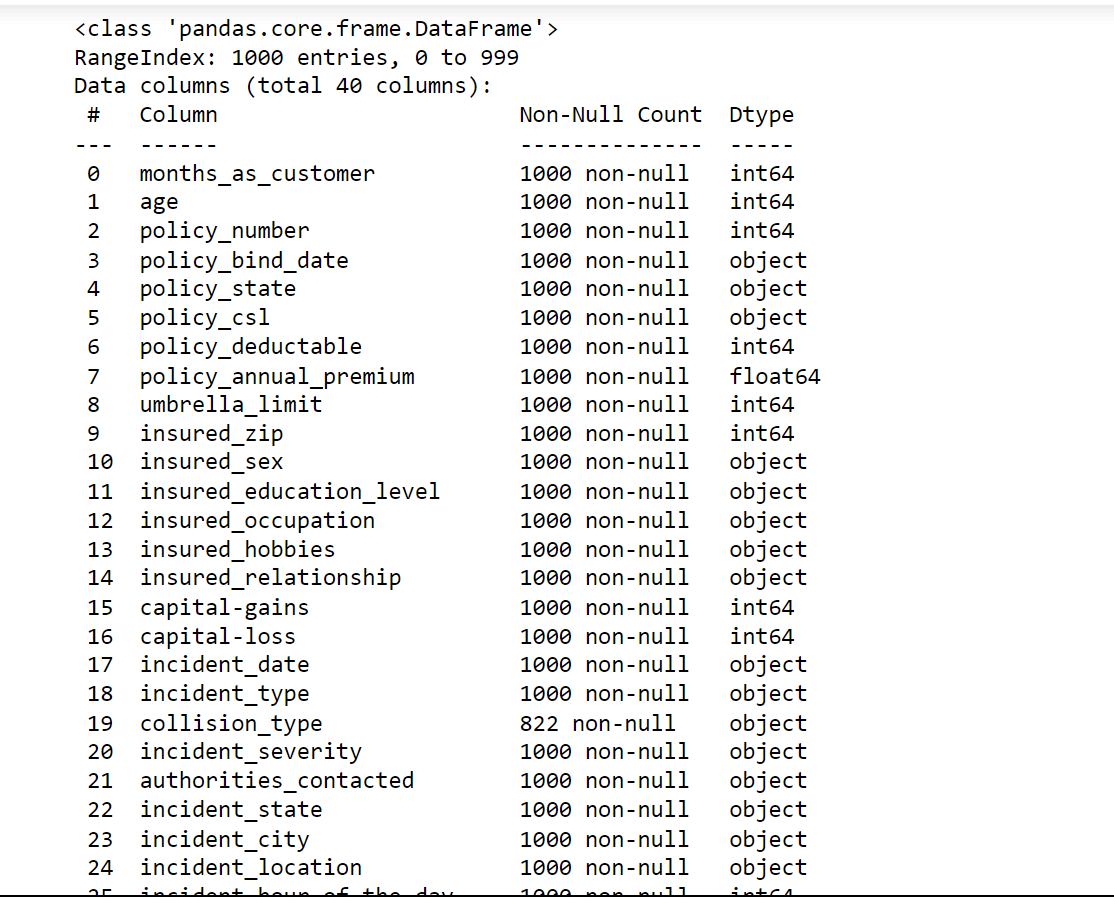
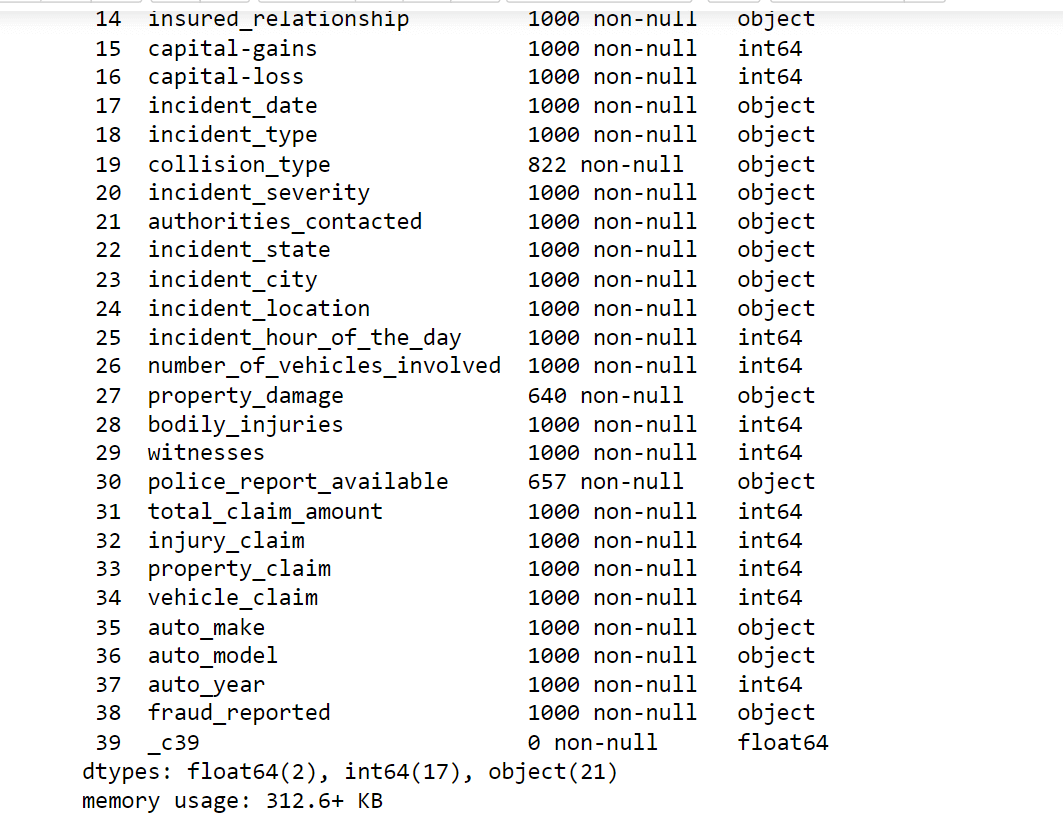
Data preprocessing is a critical step in machine learning that involves cleaning, transforming, encoding, selecting, integrating, and reducing data to prepare it for training a machine learning model. The quality of the data and how it is prepared can have a significant impact on the accuracy and performance of the model. Here, we will do the followings:
Output: 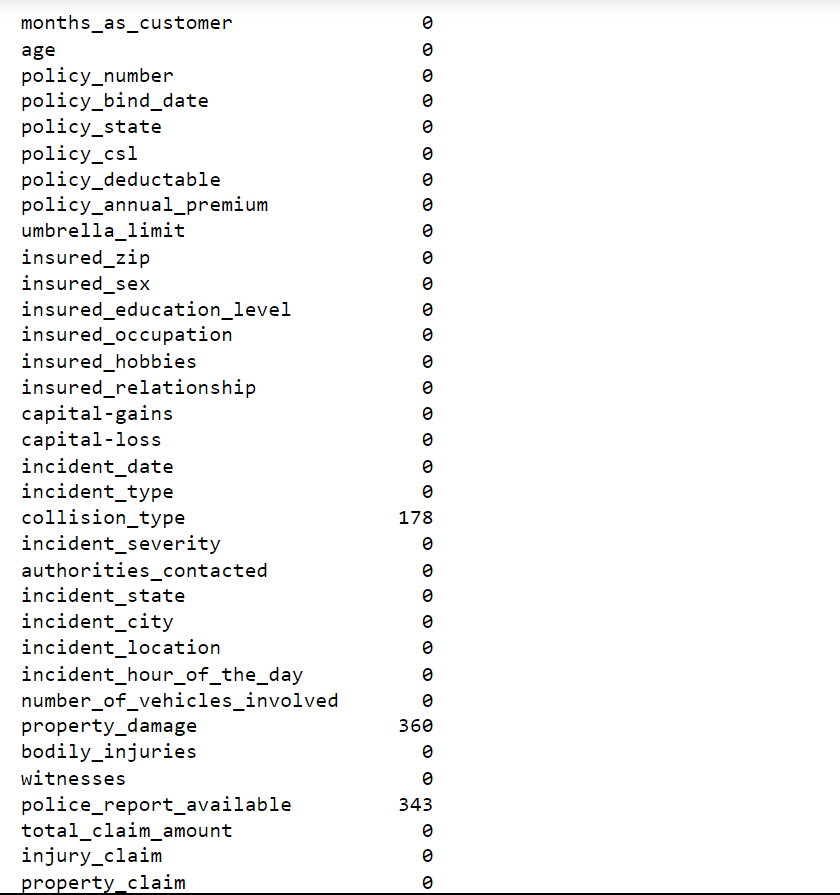
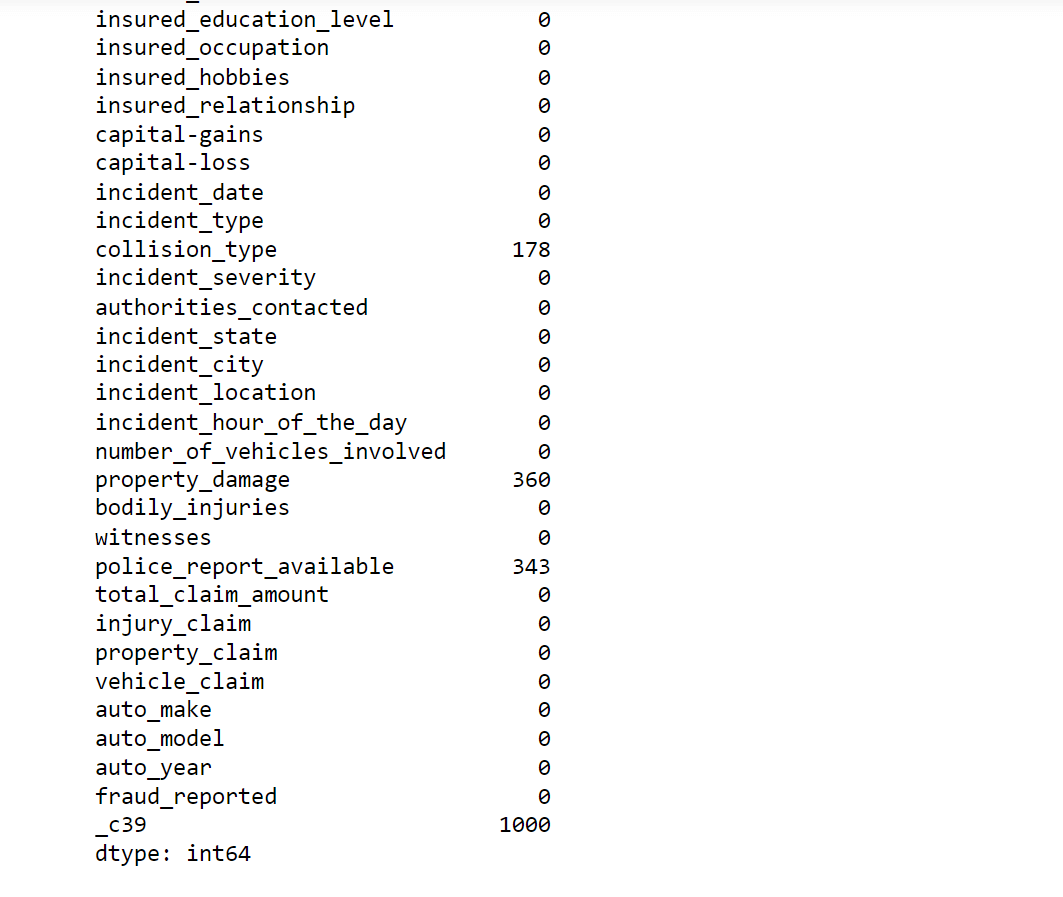
We do have missing values in our data.
Missing values can be problematic for machine learning models as they may result in biased or inaccurate results. So visualizing them would help in understanding the extent and pattern of missing data. Output: 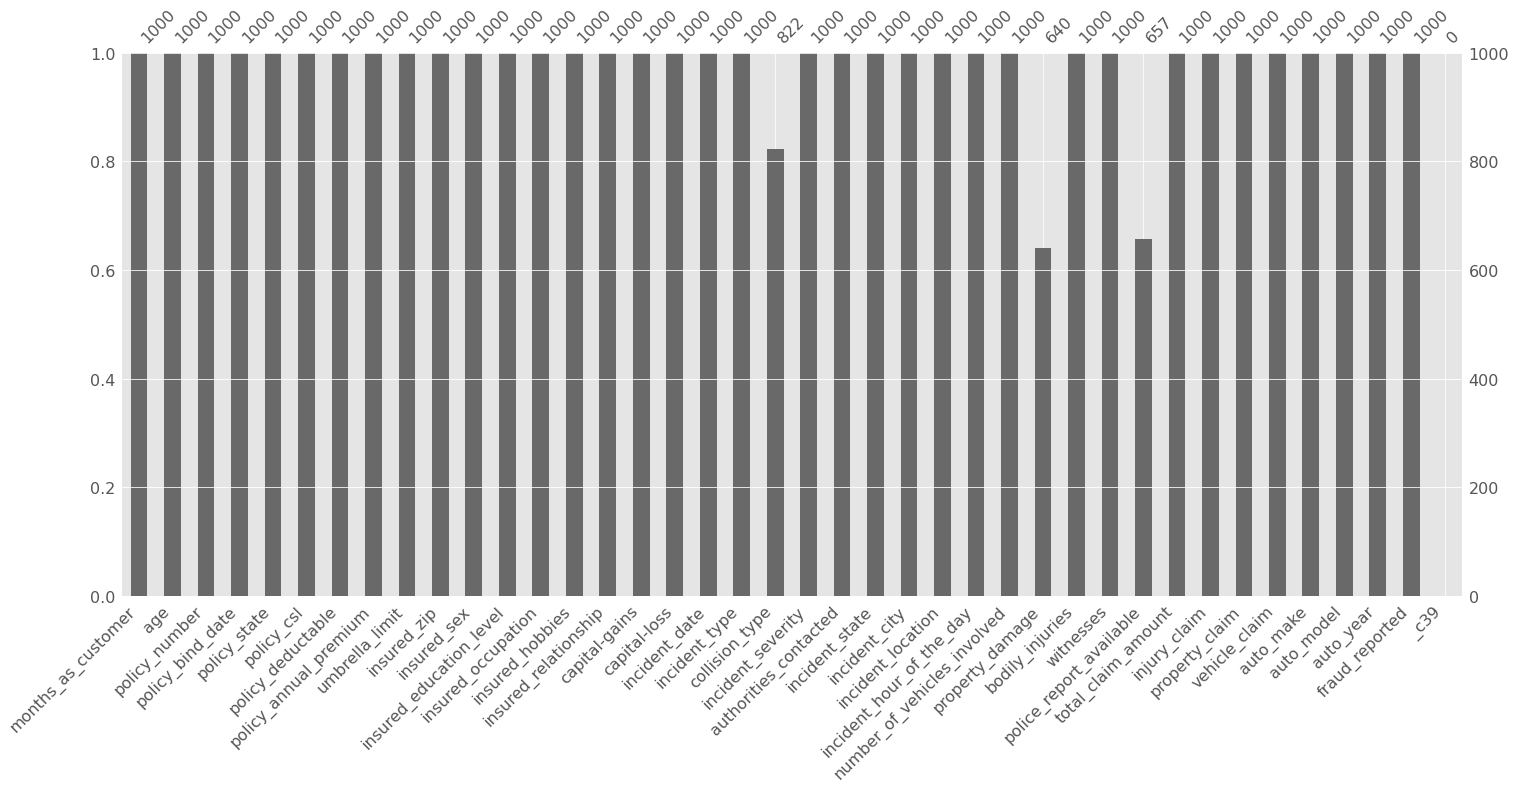
We will handle the missing value as we will allocate 0 to the missing values as a substitute. Output: 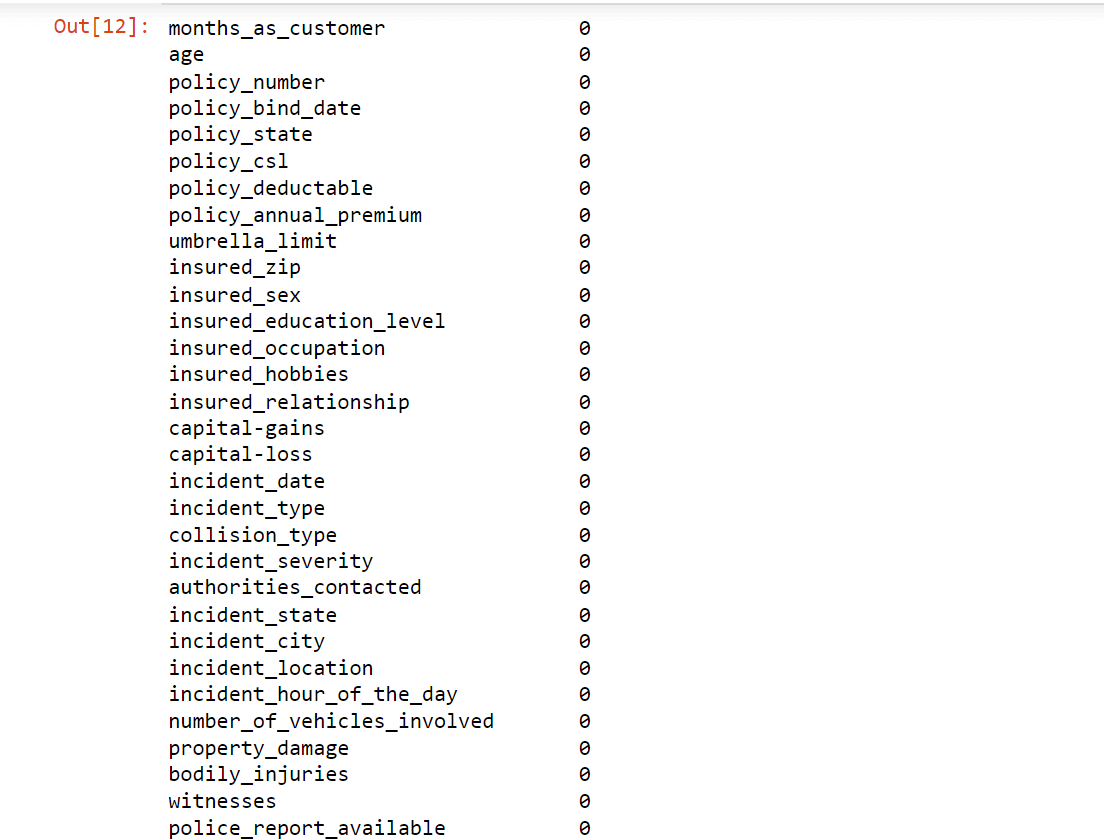
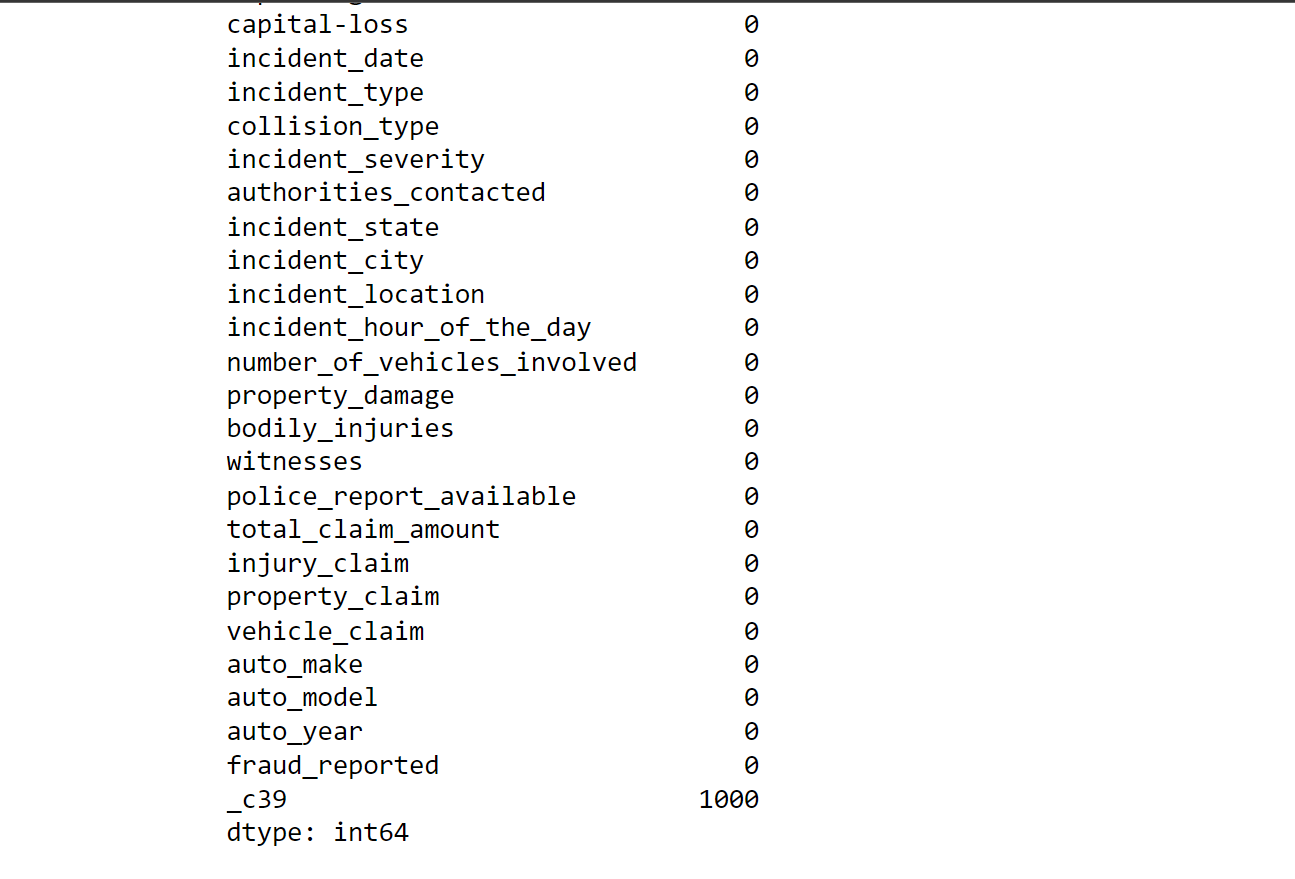
Now, there is no missing value in our data. Output: 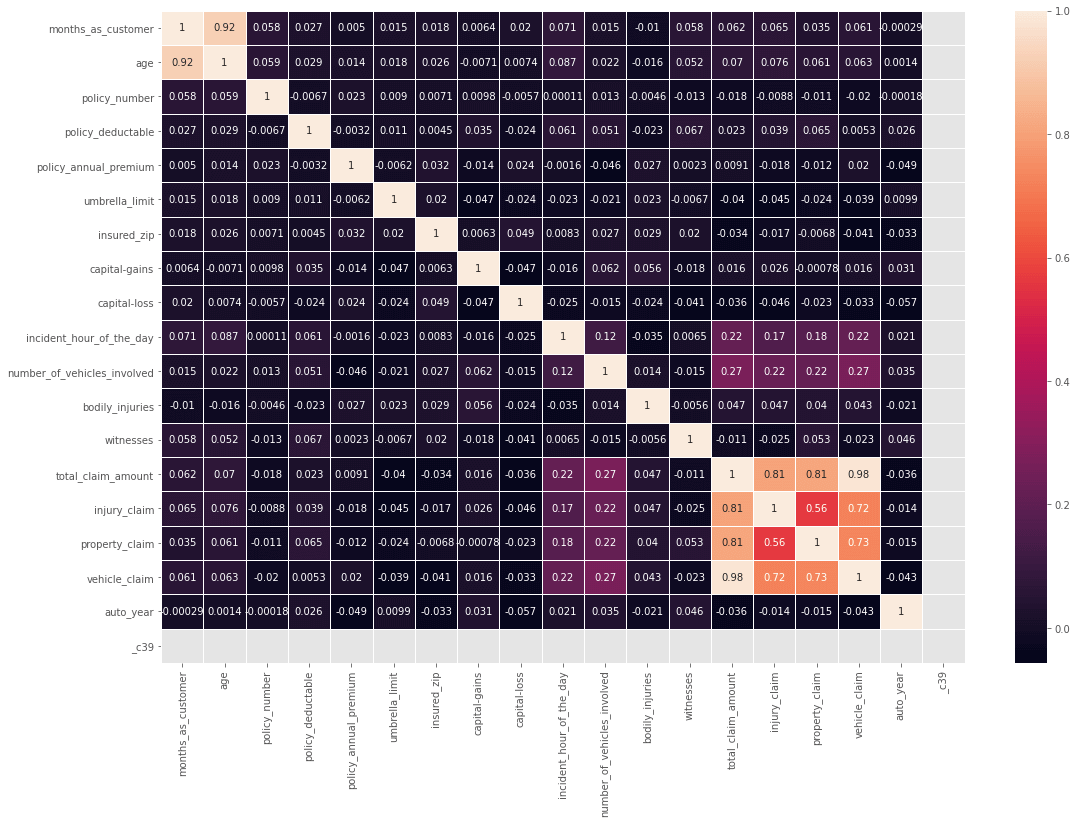
Output: 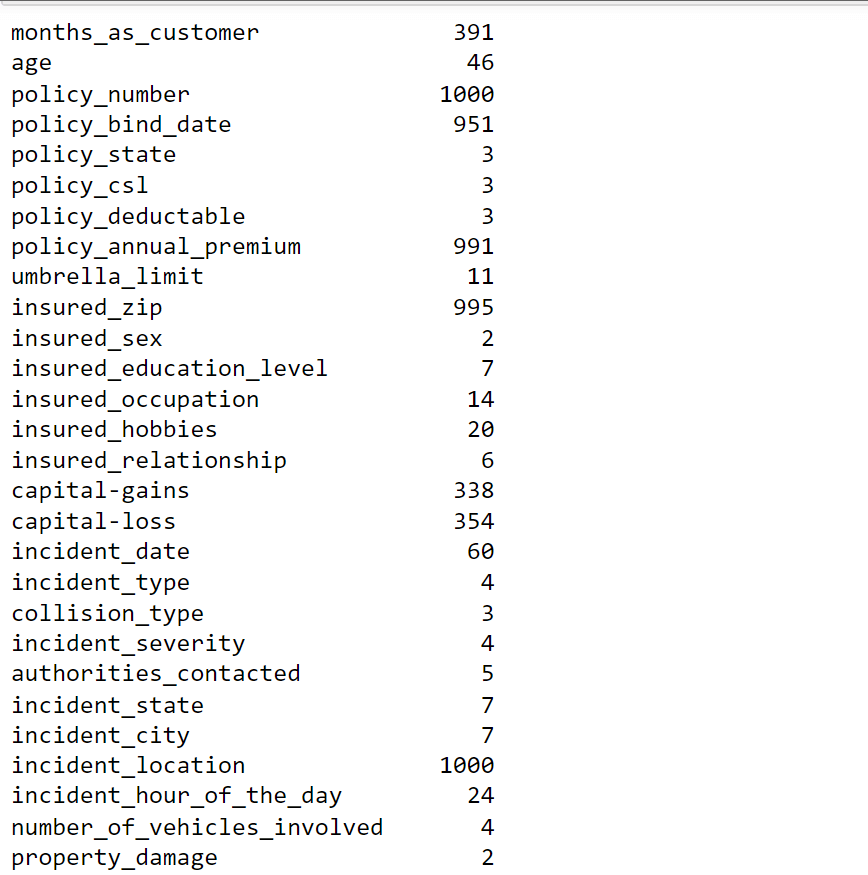
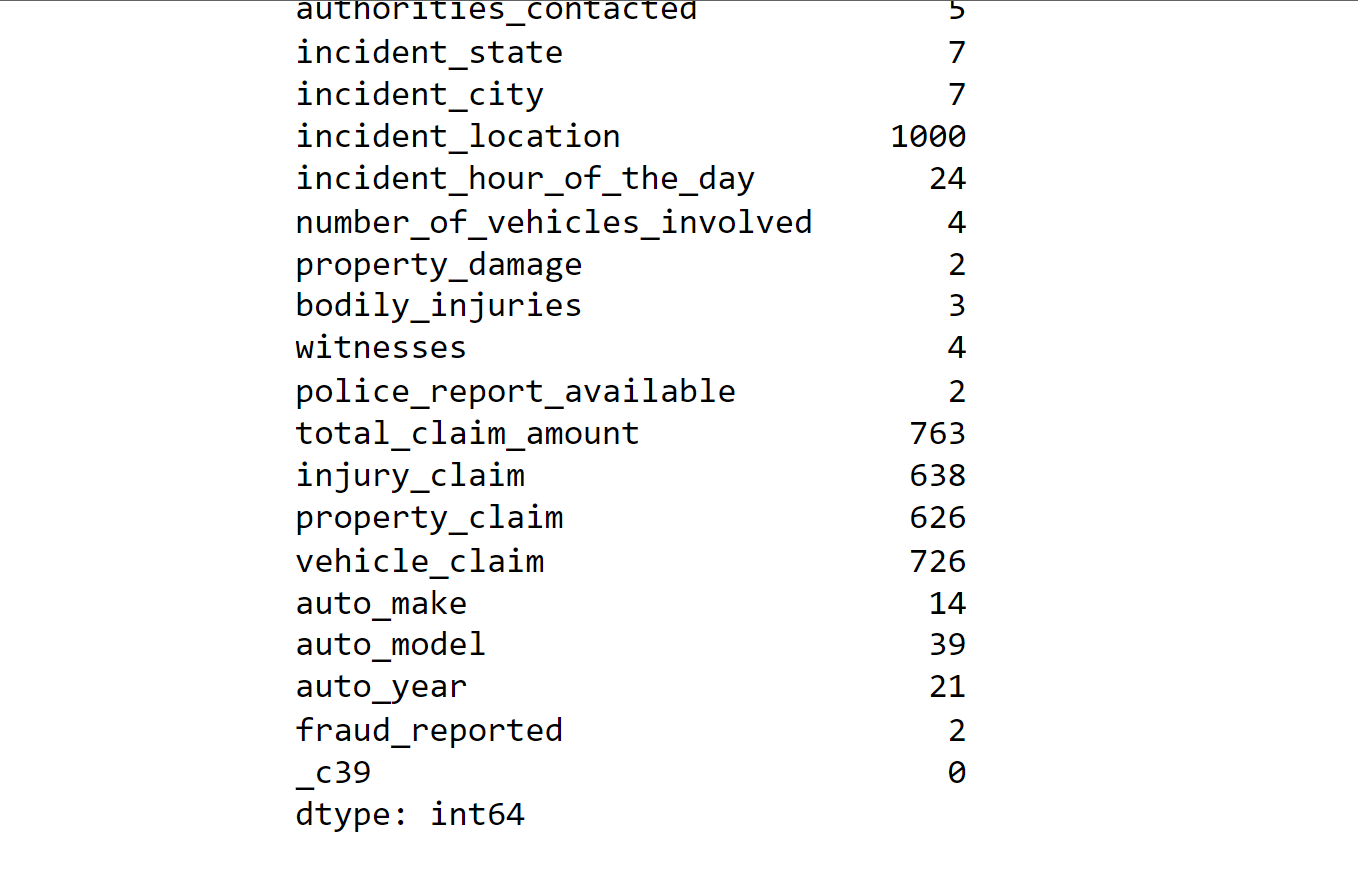
Output: 
Output: 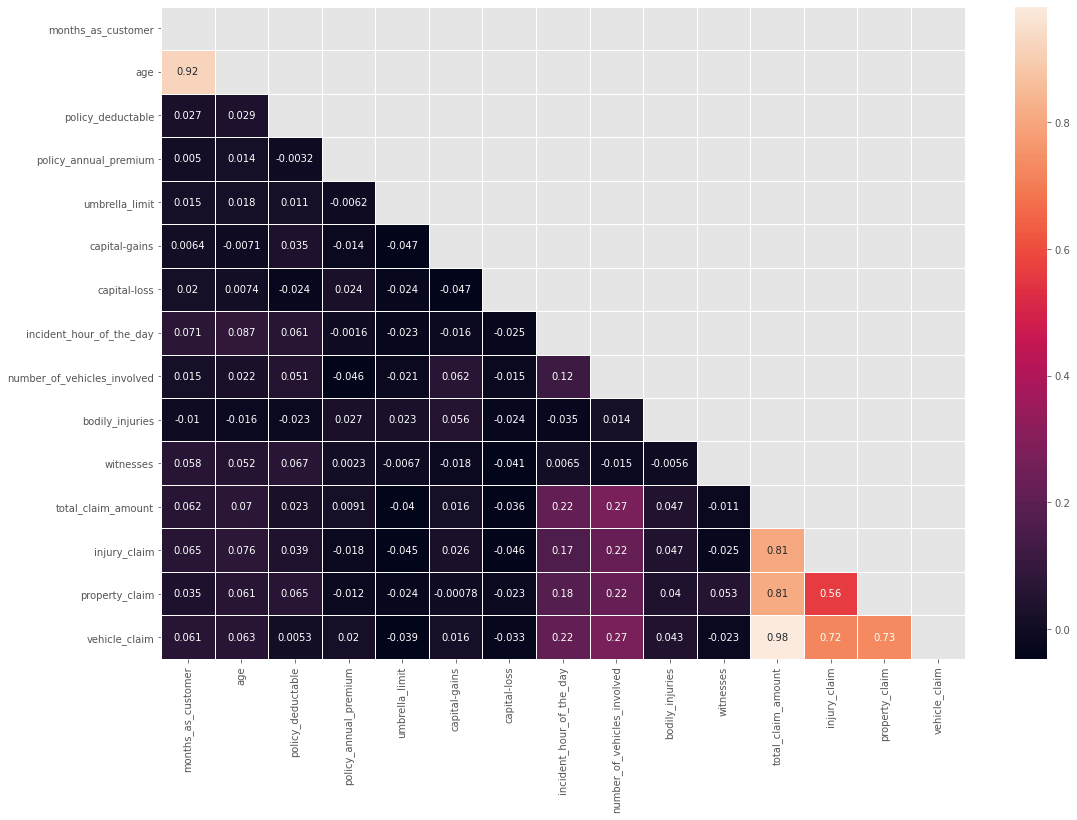
From the above plot, we can see that there is a high correlation between age and months_as_customer. We will drop the "Age" column. Also, there is a high correlation between total_clam_amount, injury_claim, property_claim, and vehicle_claim, as the total claim is the sum of all others. So we will drop the total claim column. Output: 
Output: 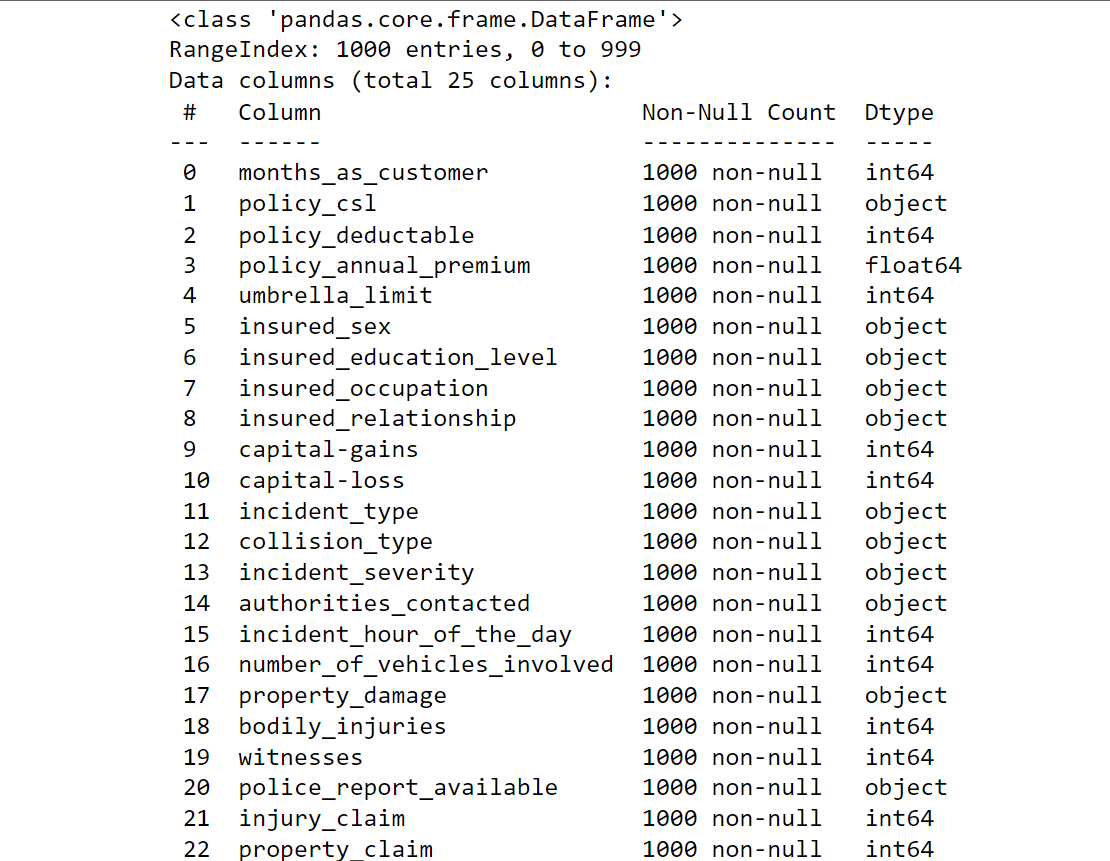
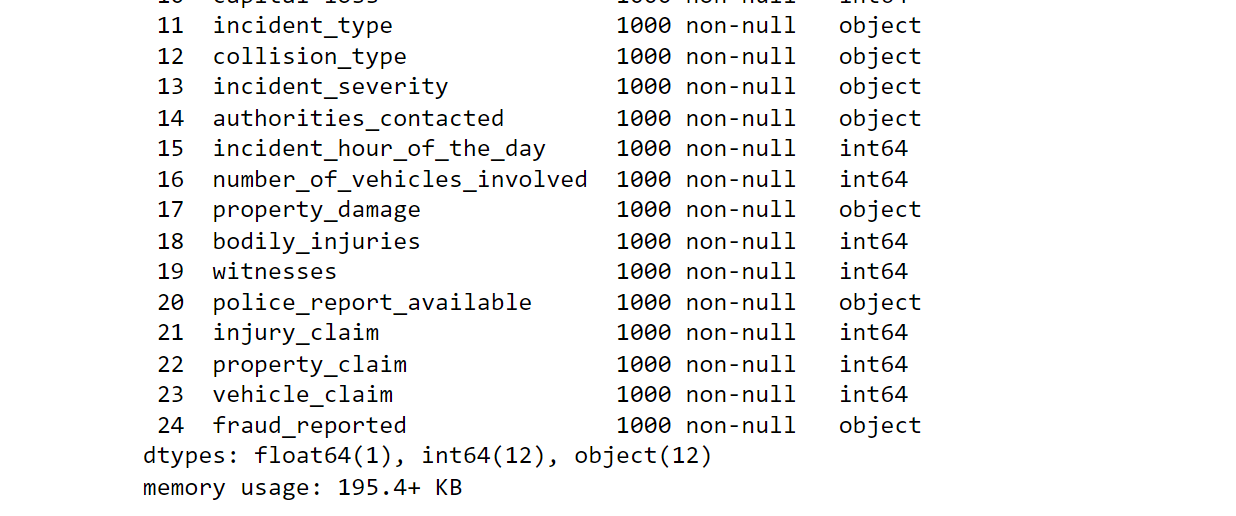
It involves converting categorical data into numerical data that can be processed by machine learning models. We will encode categorical variables into numerical data so that our model will have the ease to predict insurance fraud. Output: 
Output: 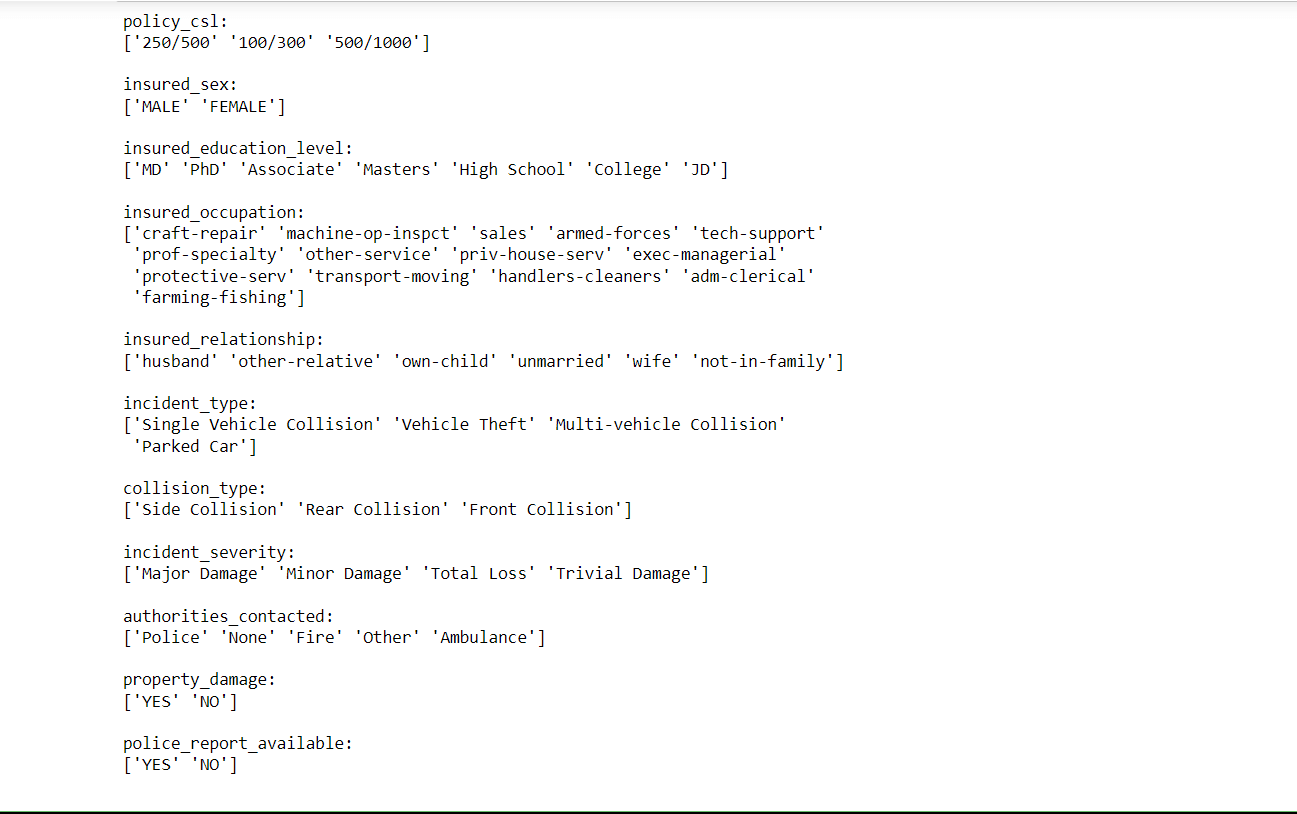
Output: 
Output: 
Output: 
Output: 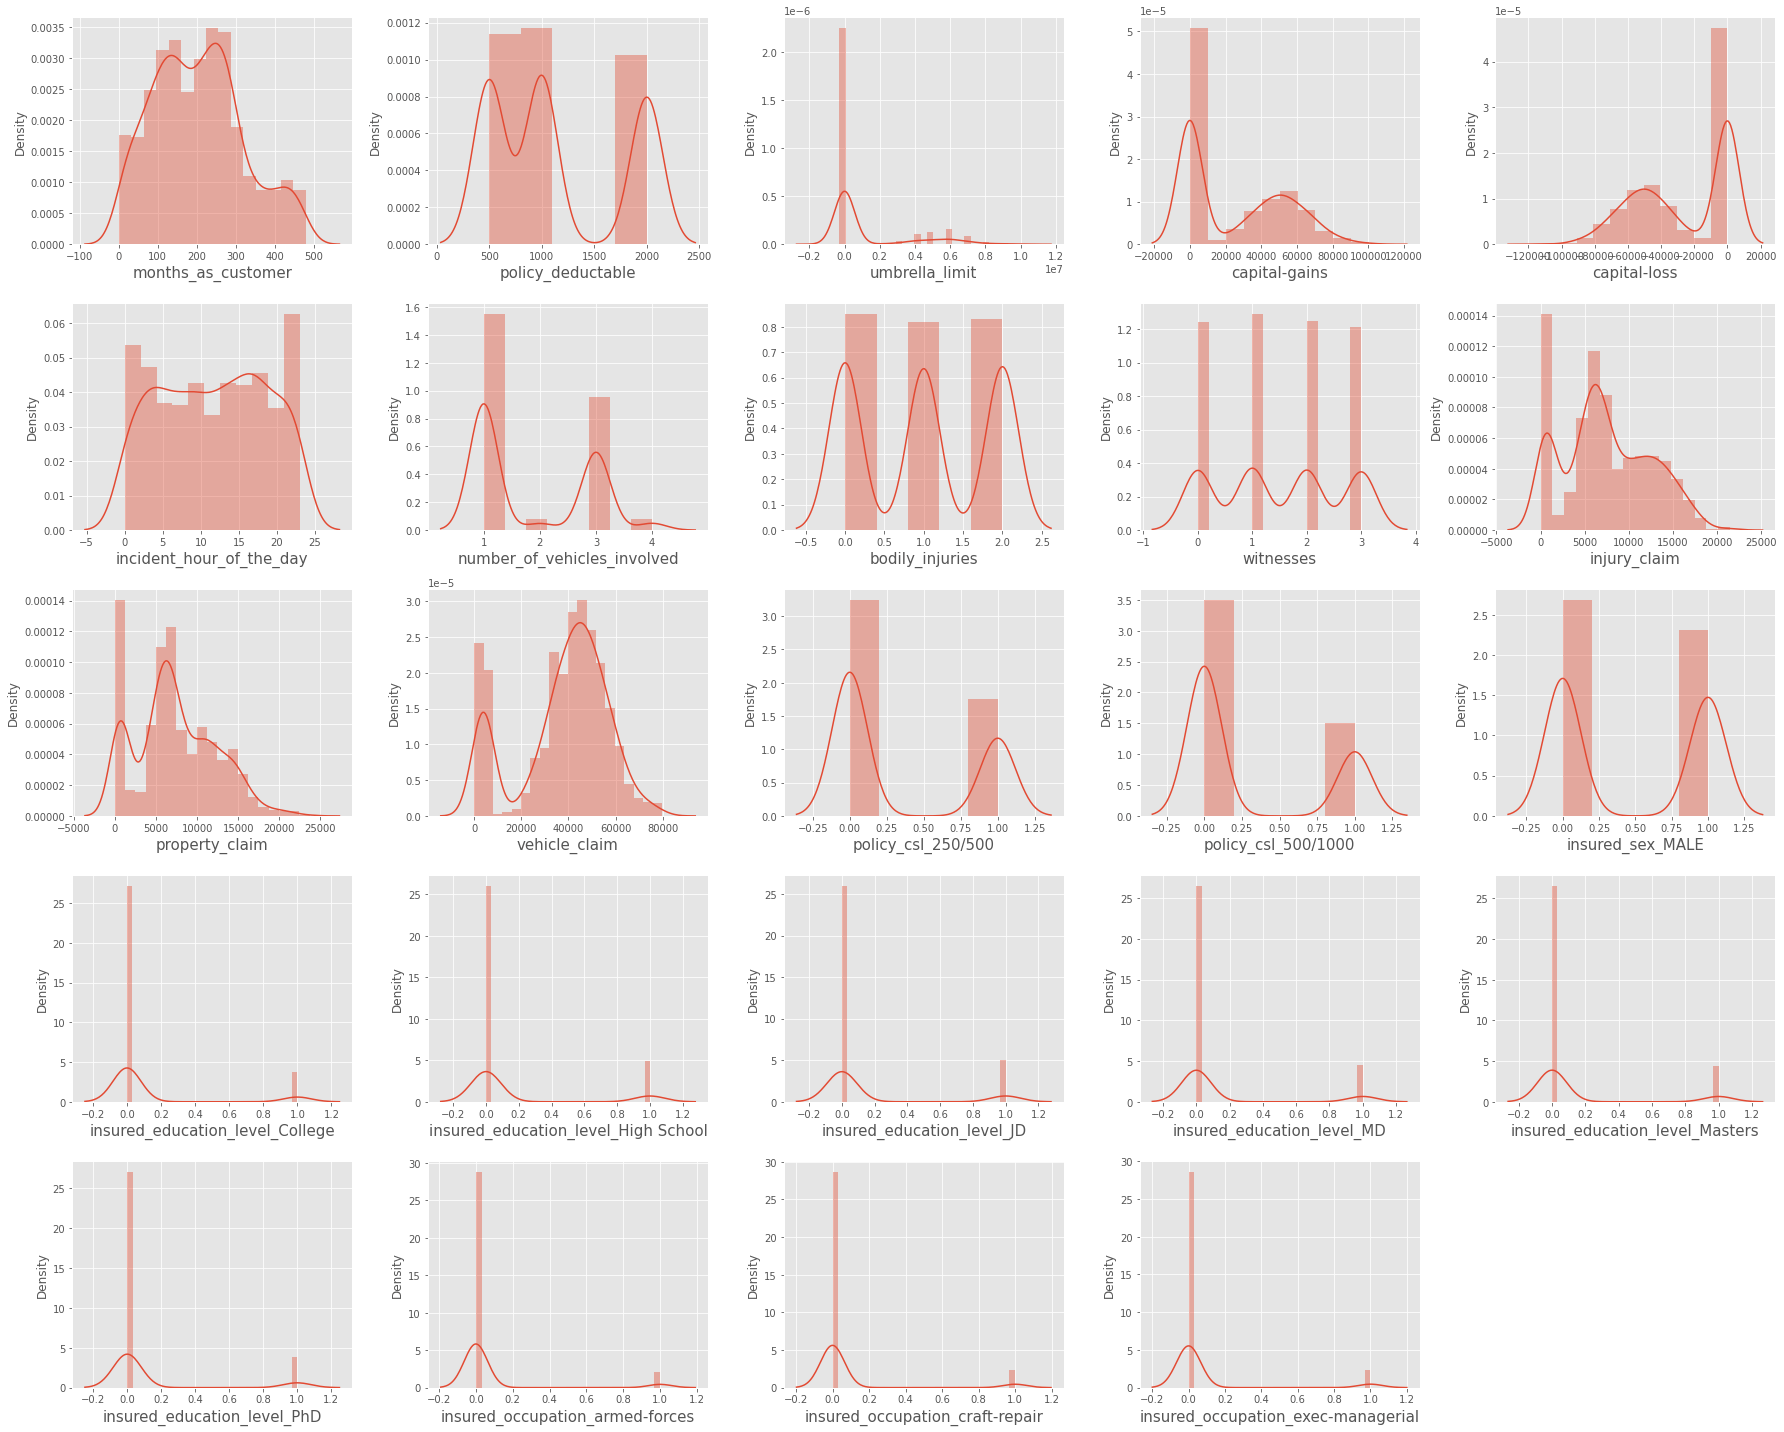
The data looks good. Let's check for outliers.
Data points known as outliers differ dramatically from other data points in a dataset. Outliers can appear for a number of reasons, including measurement mistakes, data input problems, or inherent data variability. Statistical analysis and machine learning models can be significantly impacted by outliers because they might provide estimates that are skewed or forecasts that are incorrect. We will try to look out for the outliers in our data. Output: 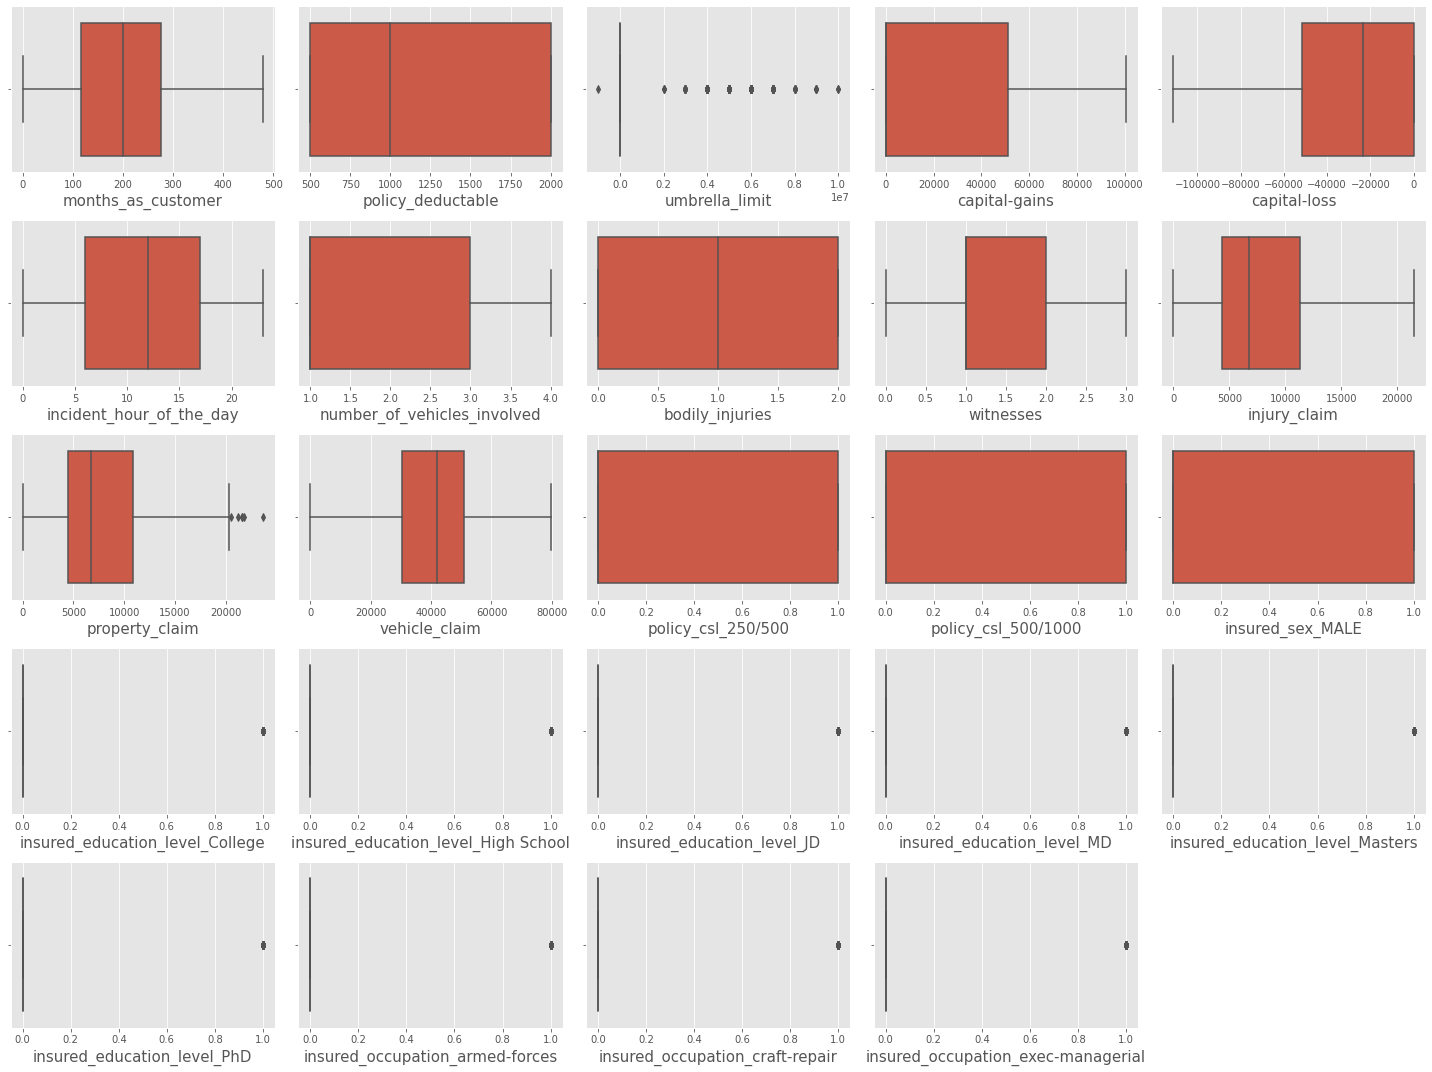
Outliers are present in some numerical columns. We will scale numerical columns later. Output: 
Output: 
Output: 
Now, we will train and test the following models:
There will also check on the accuracy of the models. 1.SVM Output: 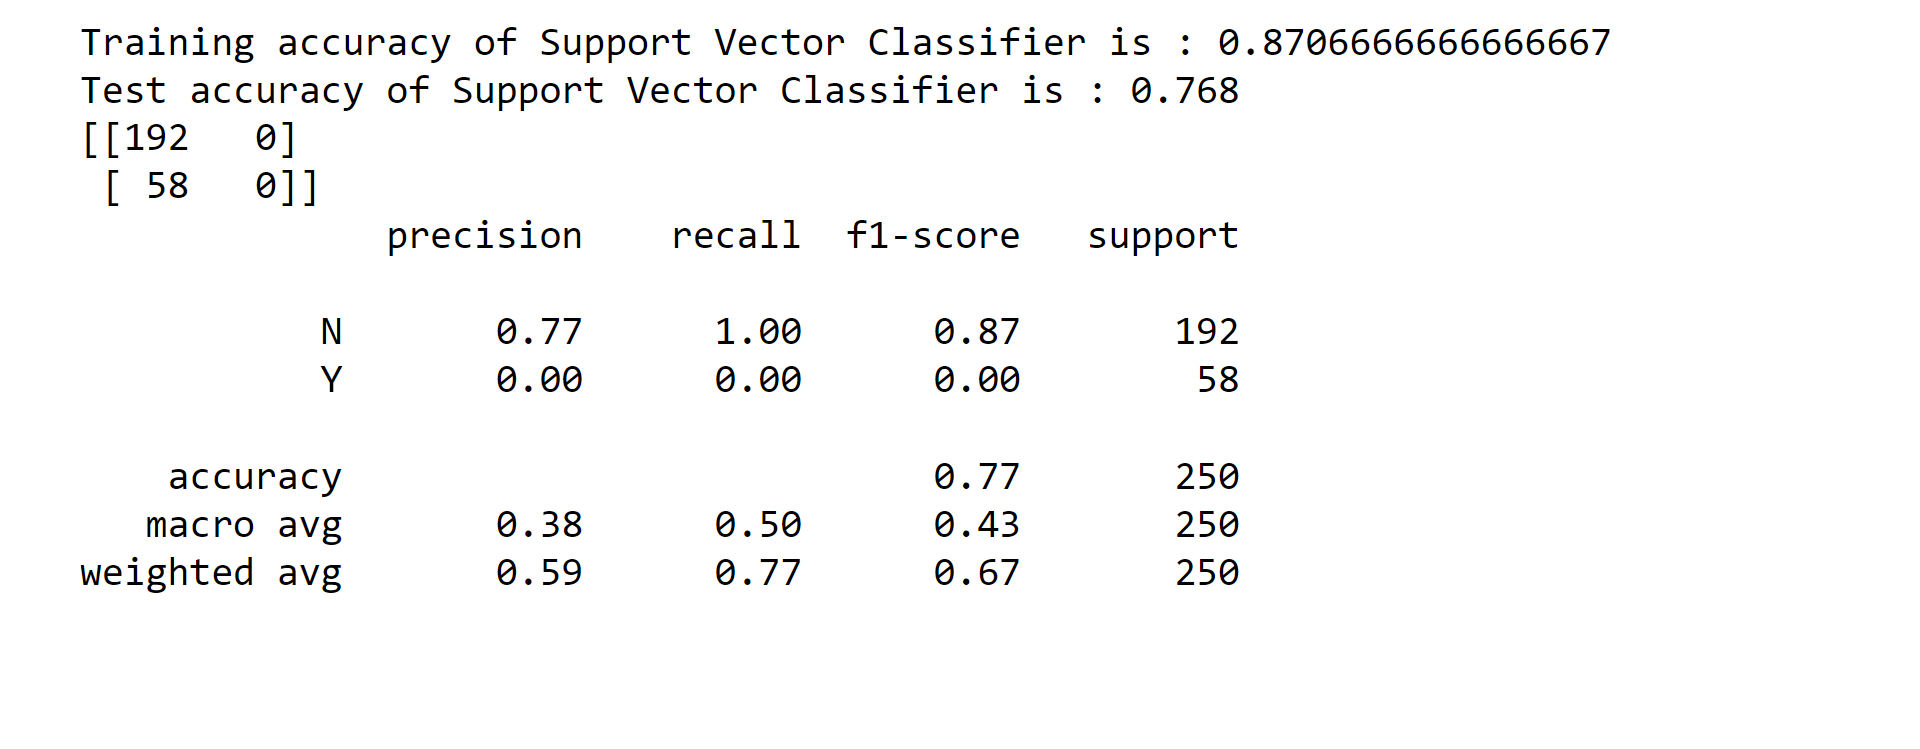
2. KNN Output: 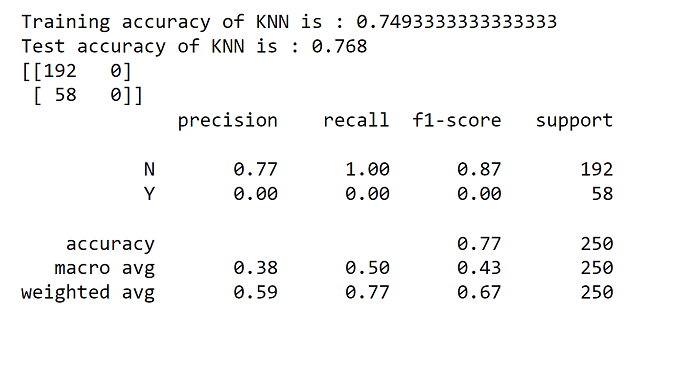
3. Decision Tree Classifier Output: 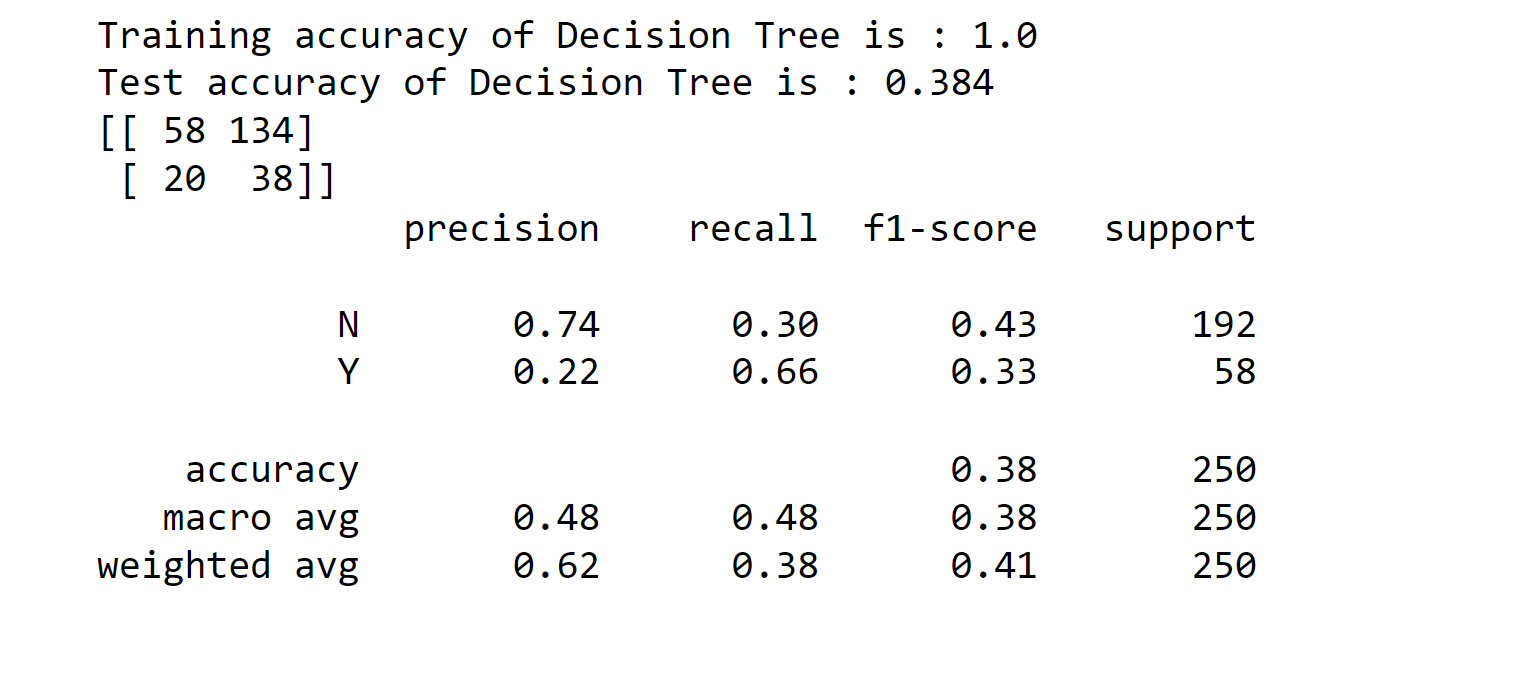
Output: 
Output: 
Output: 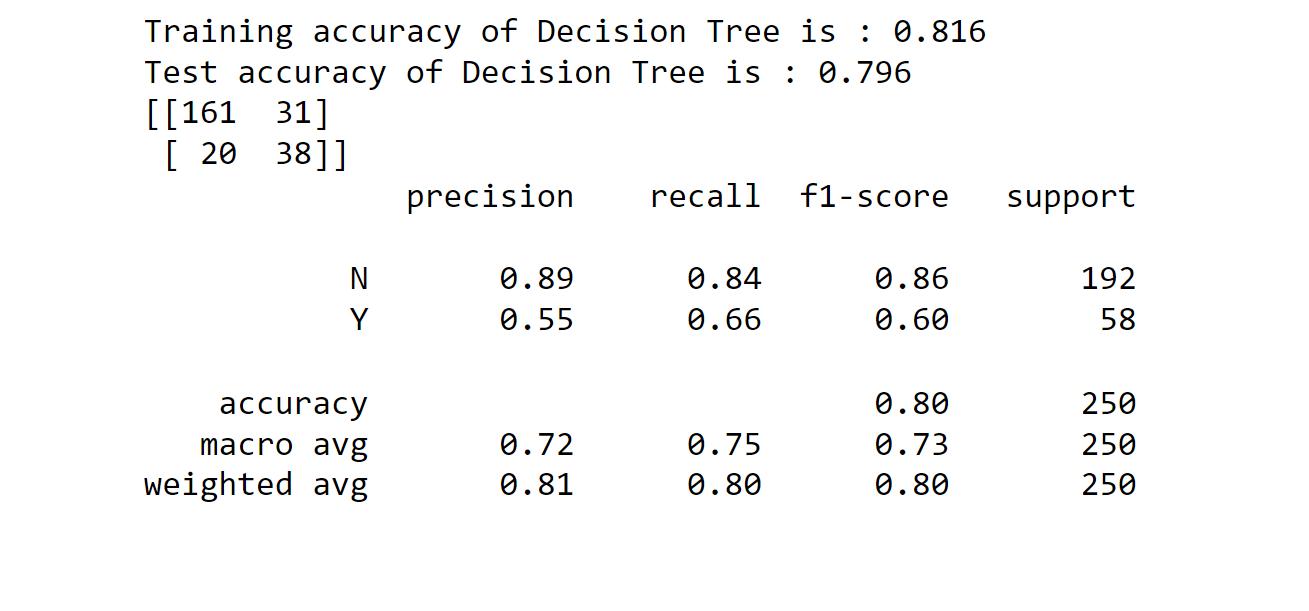
4. Random Forest Classifier Output: 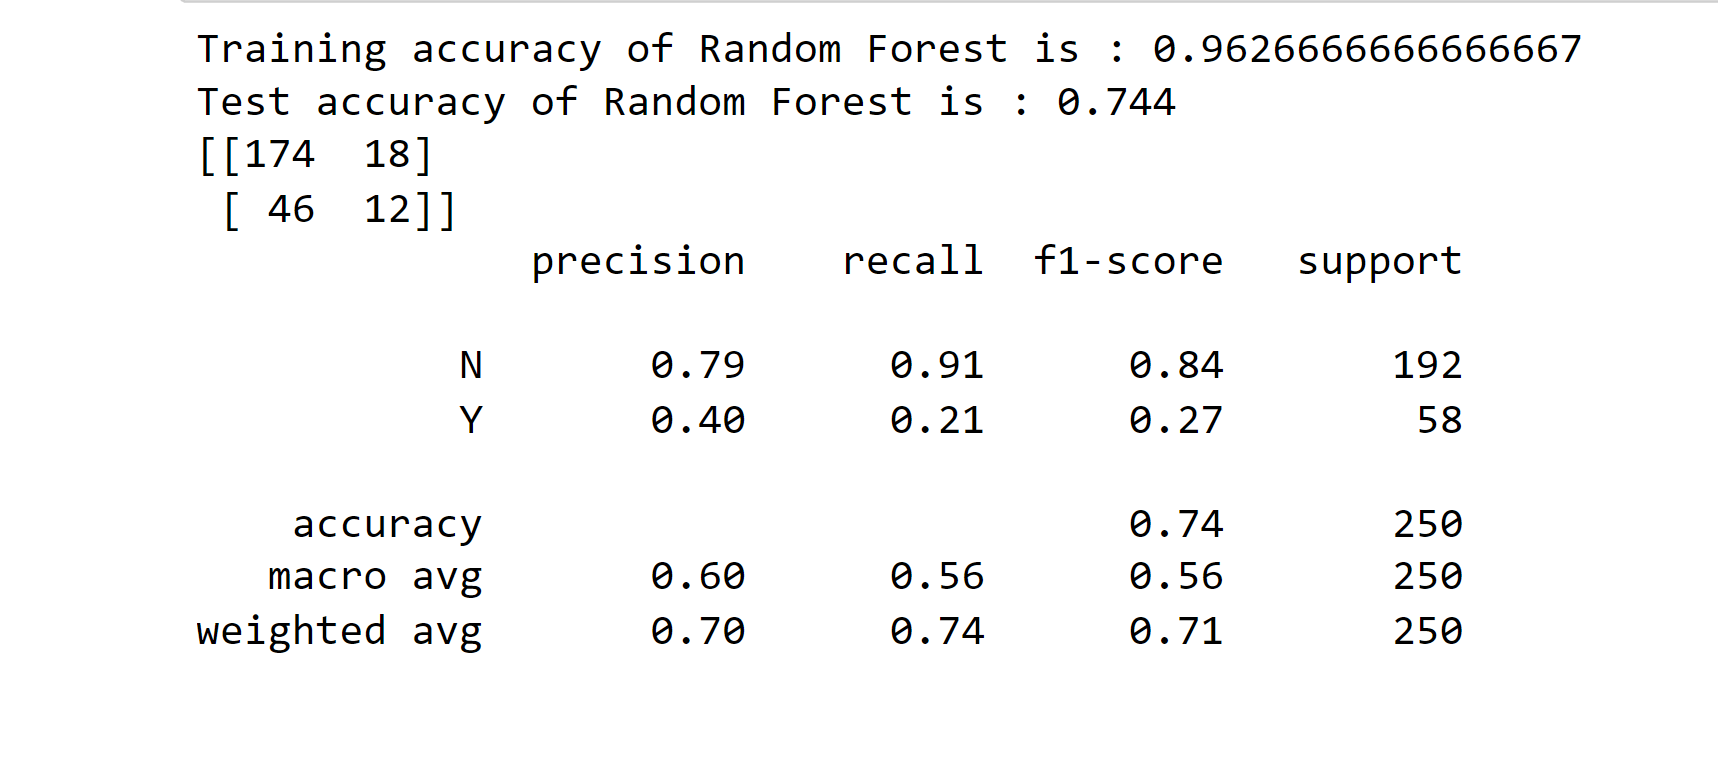
5. Ada Boost Classifier Output: 
Output: 
Output: 
6. Gradient Boosting Classifier Output: 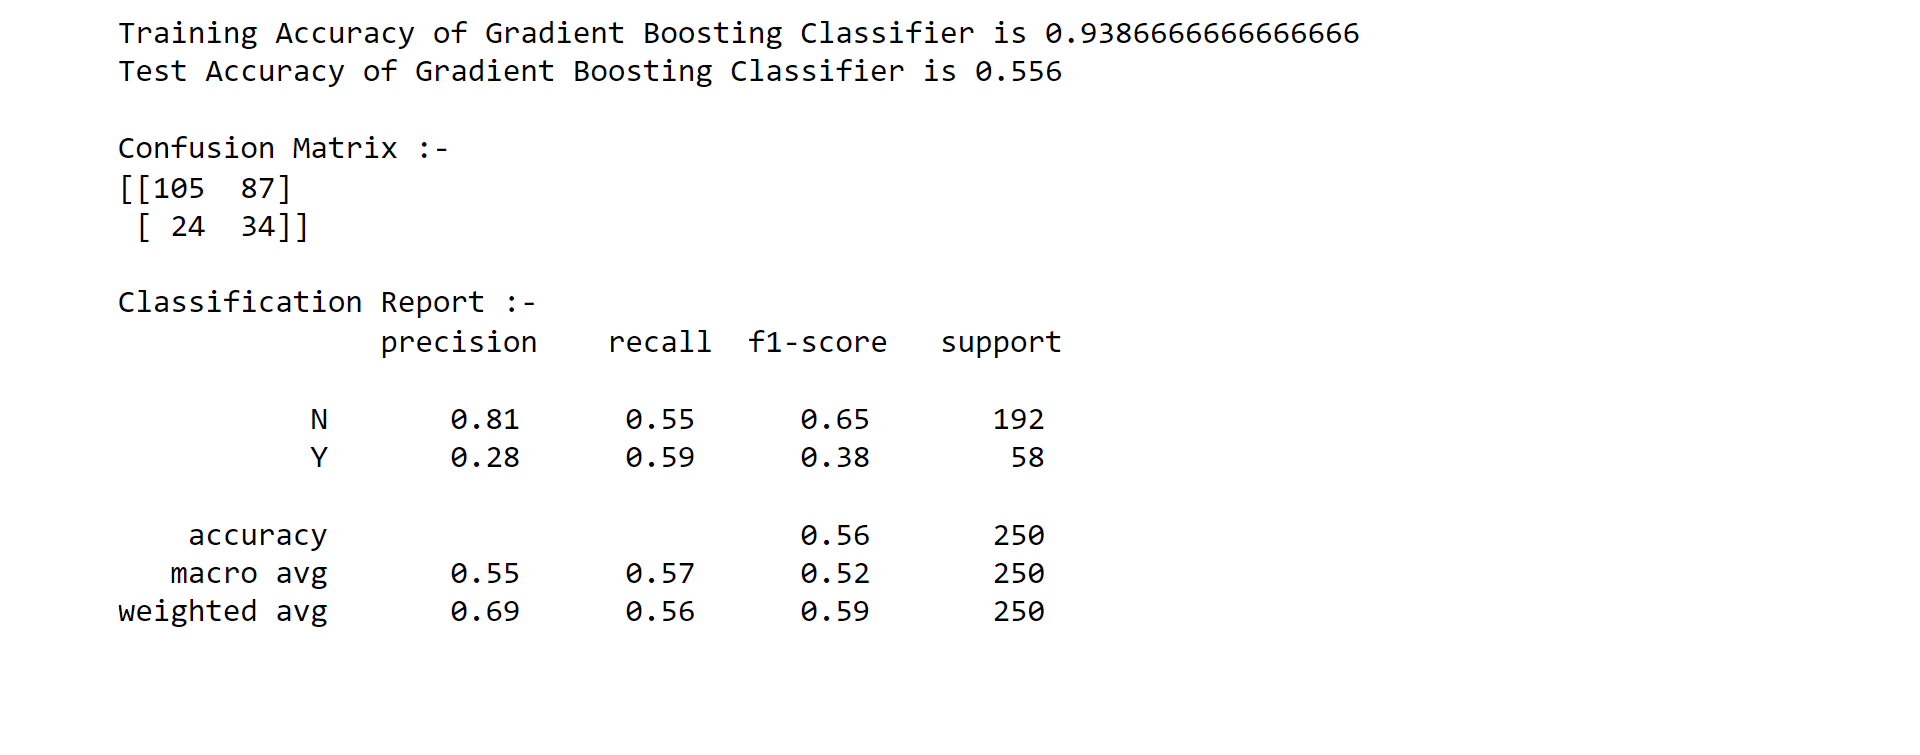
7. Stochastic Gradient Boosting (SGB) Output: 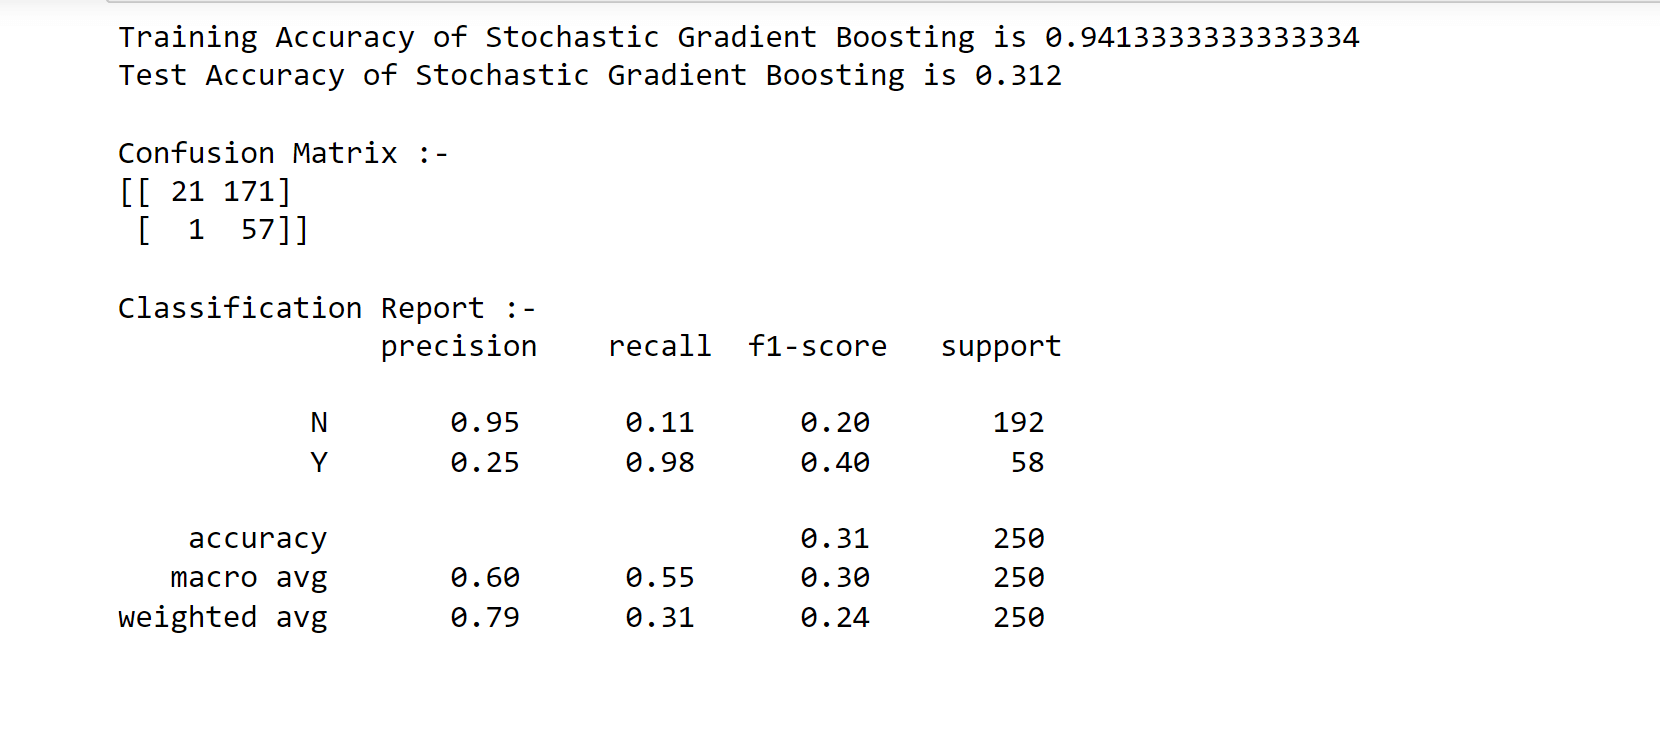
8.XGBoost Classifier Output: 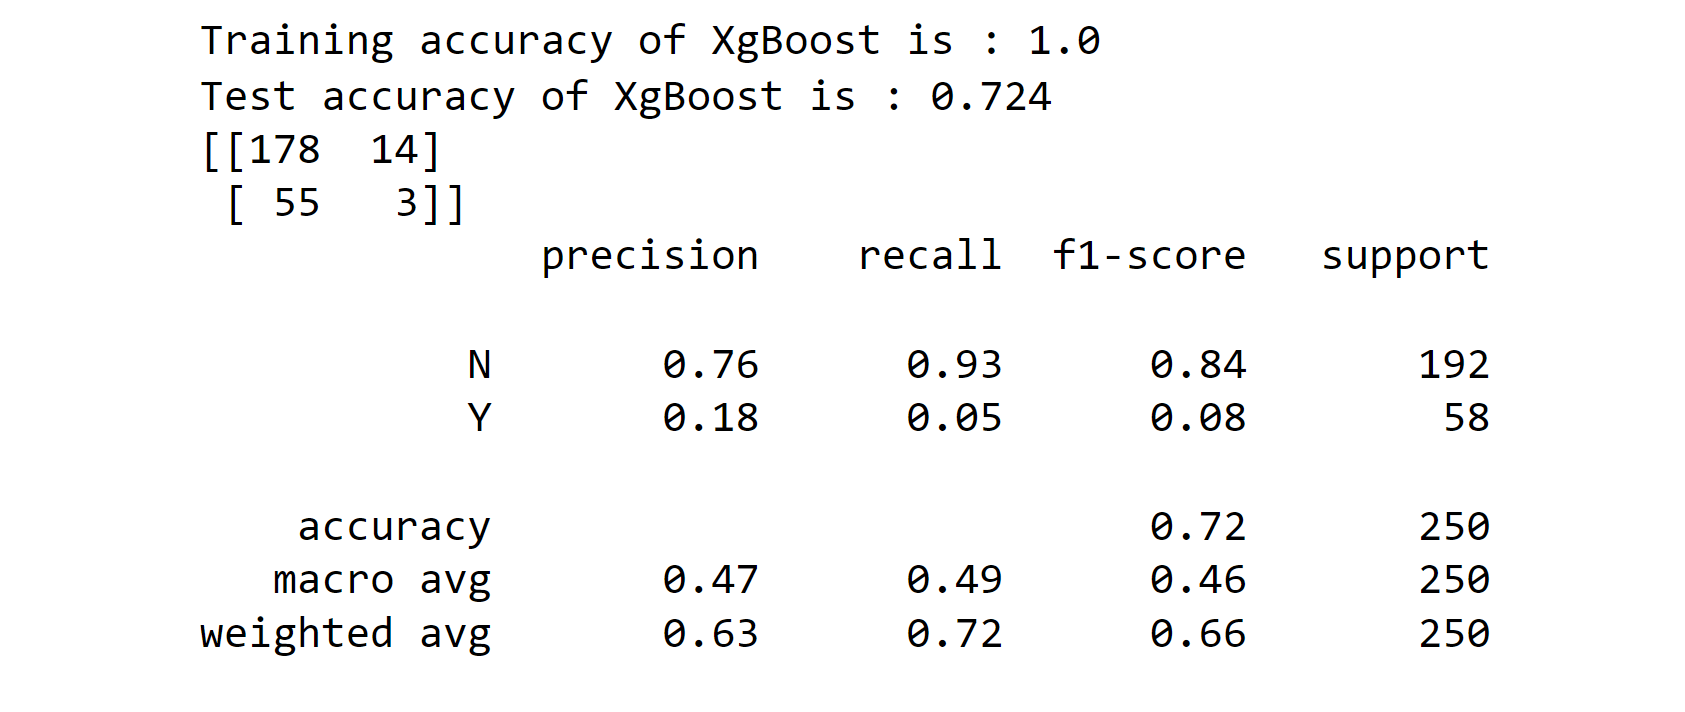
Output: 
Output: 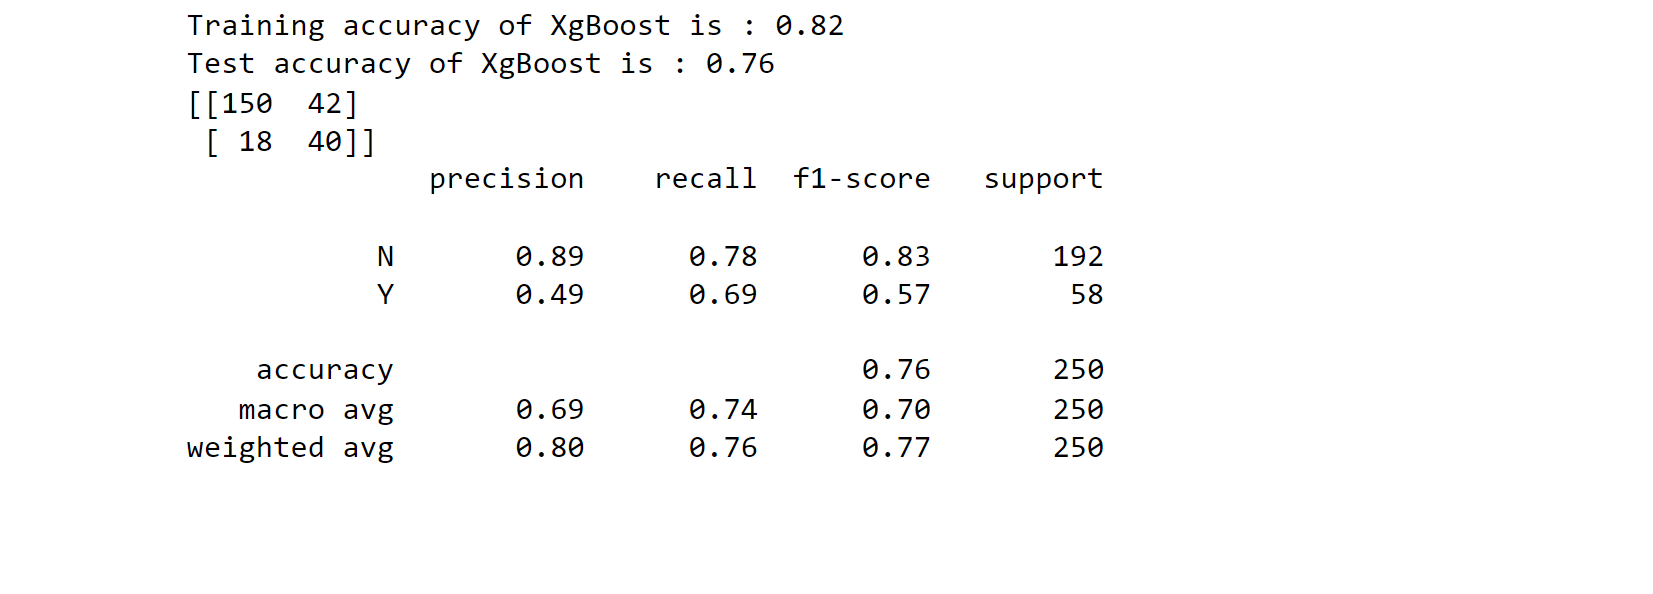
9. Cat Boost Classifier Output: 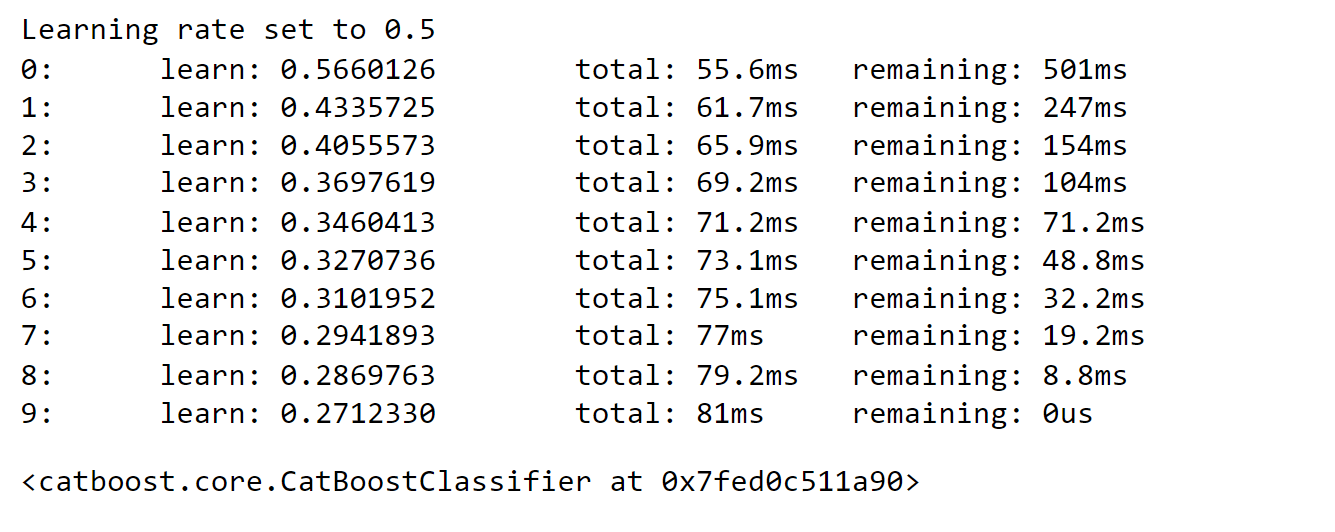
Output: 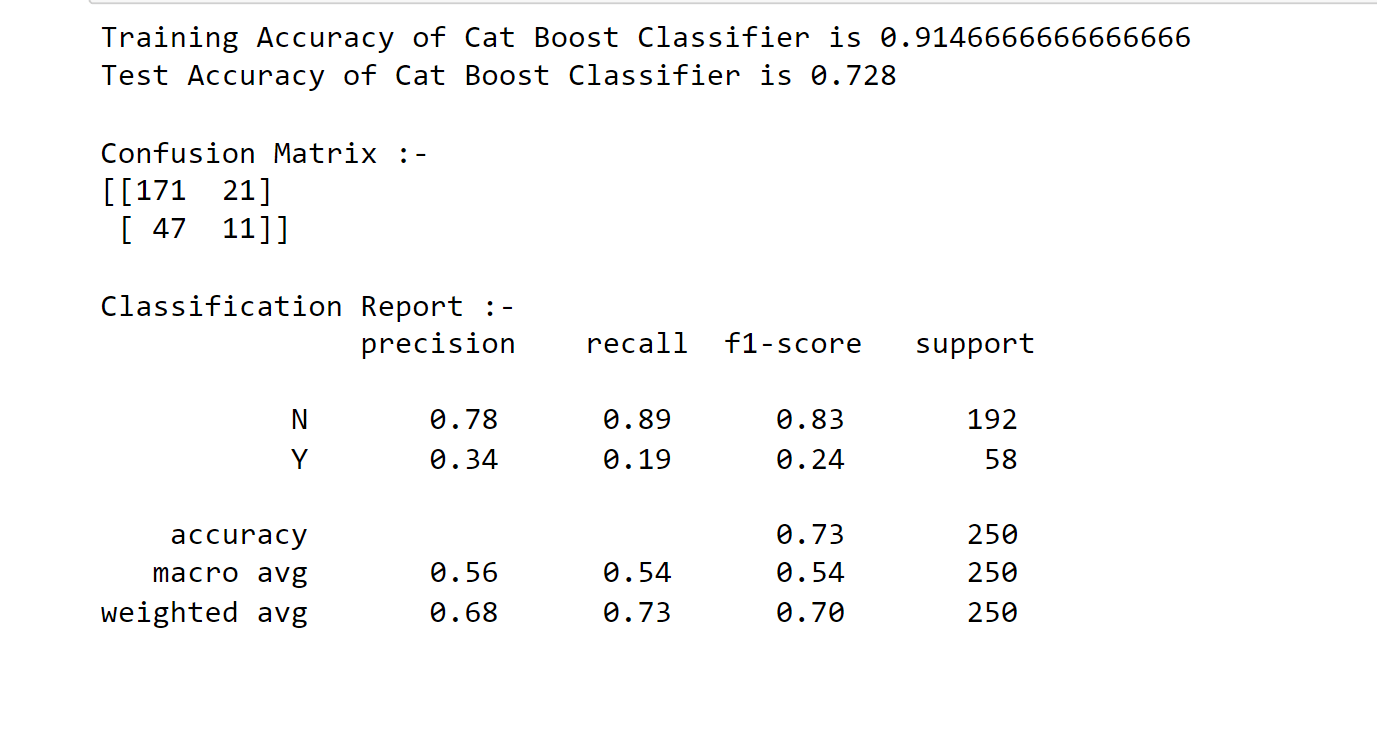
10. Extra Trees Classifier Output: 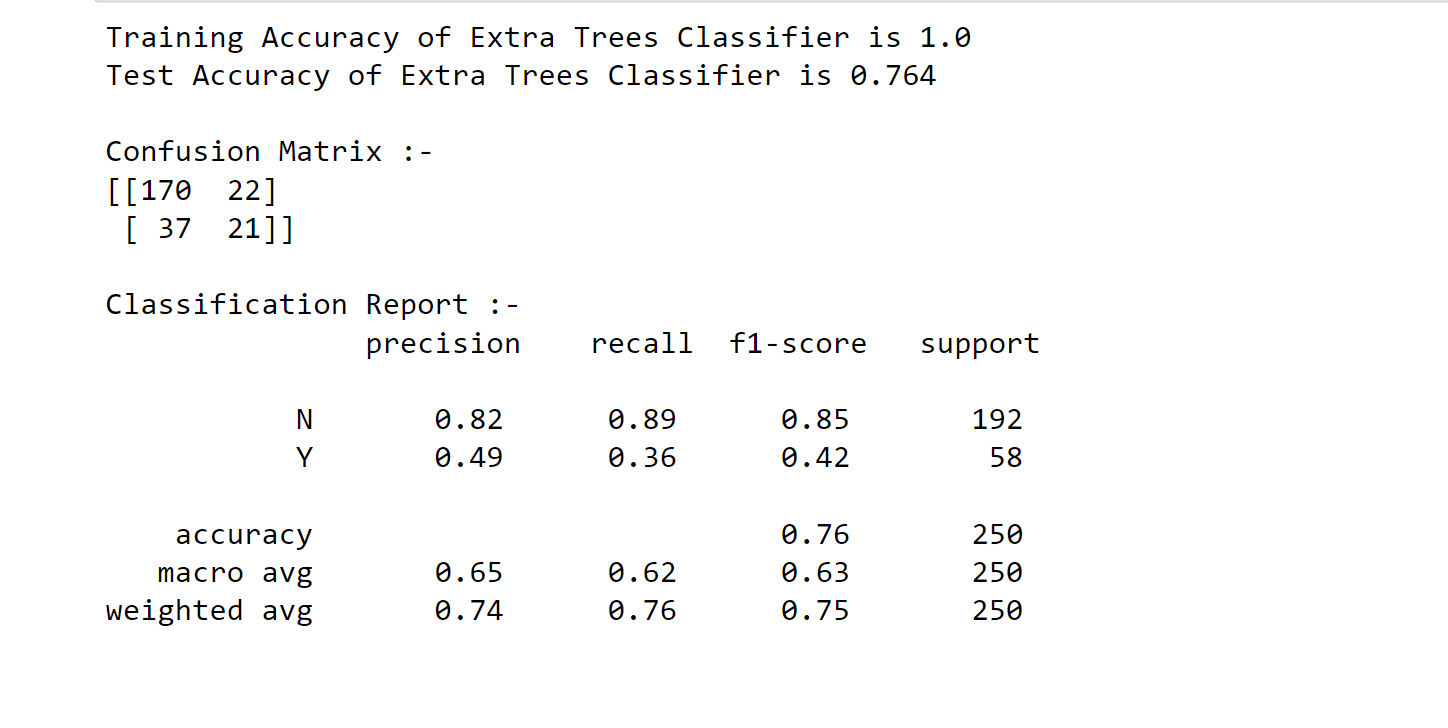
11. LGBM Classifier Output: 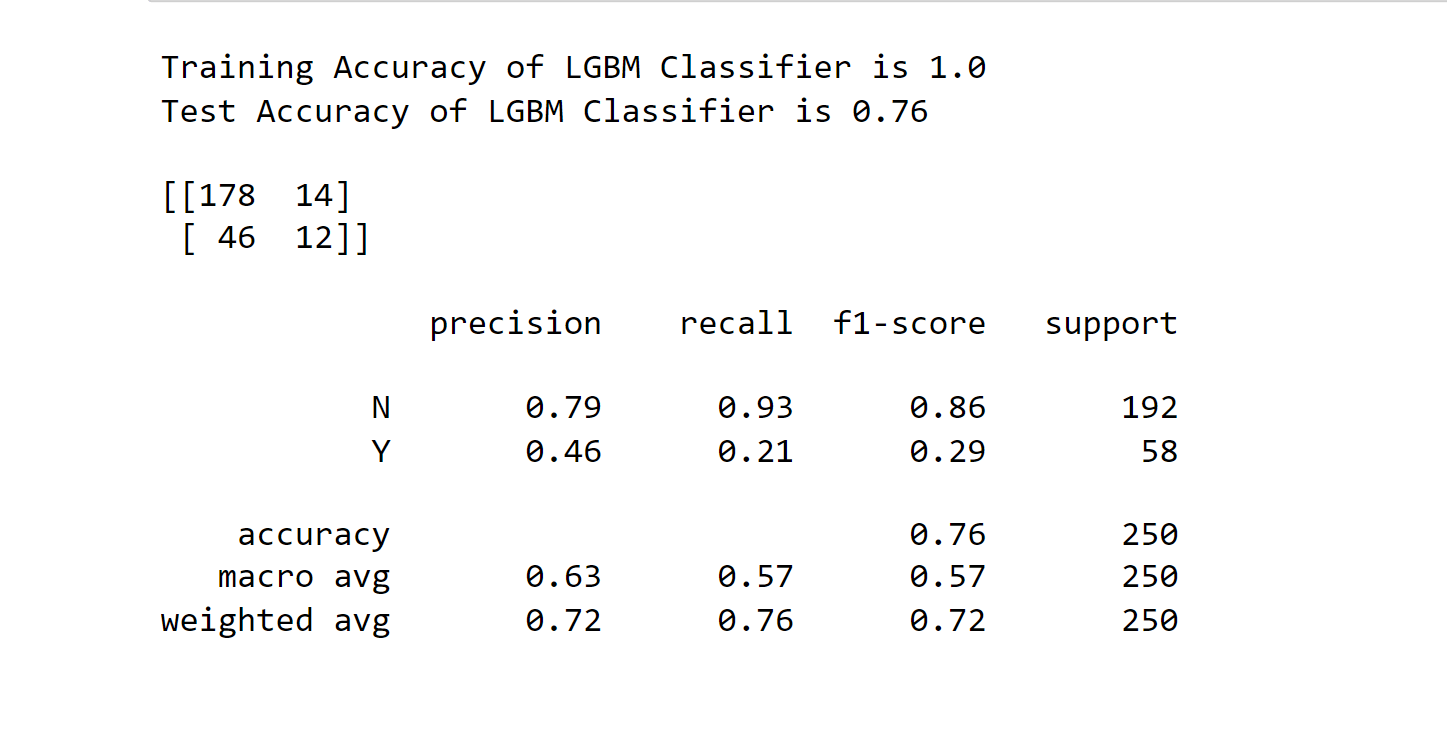
12. Voting Classifier Output: 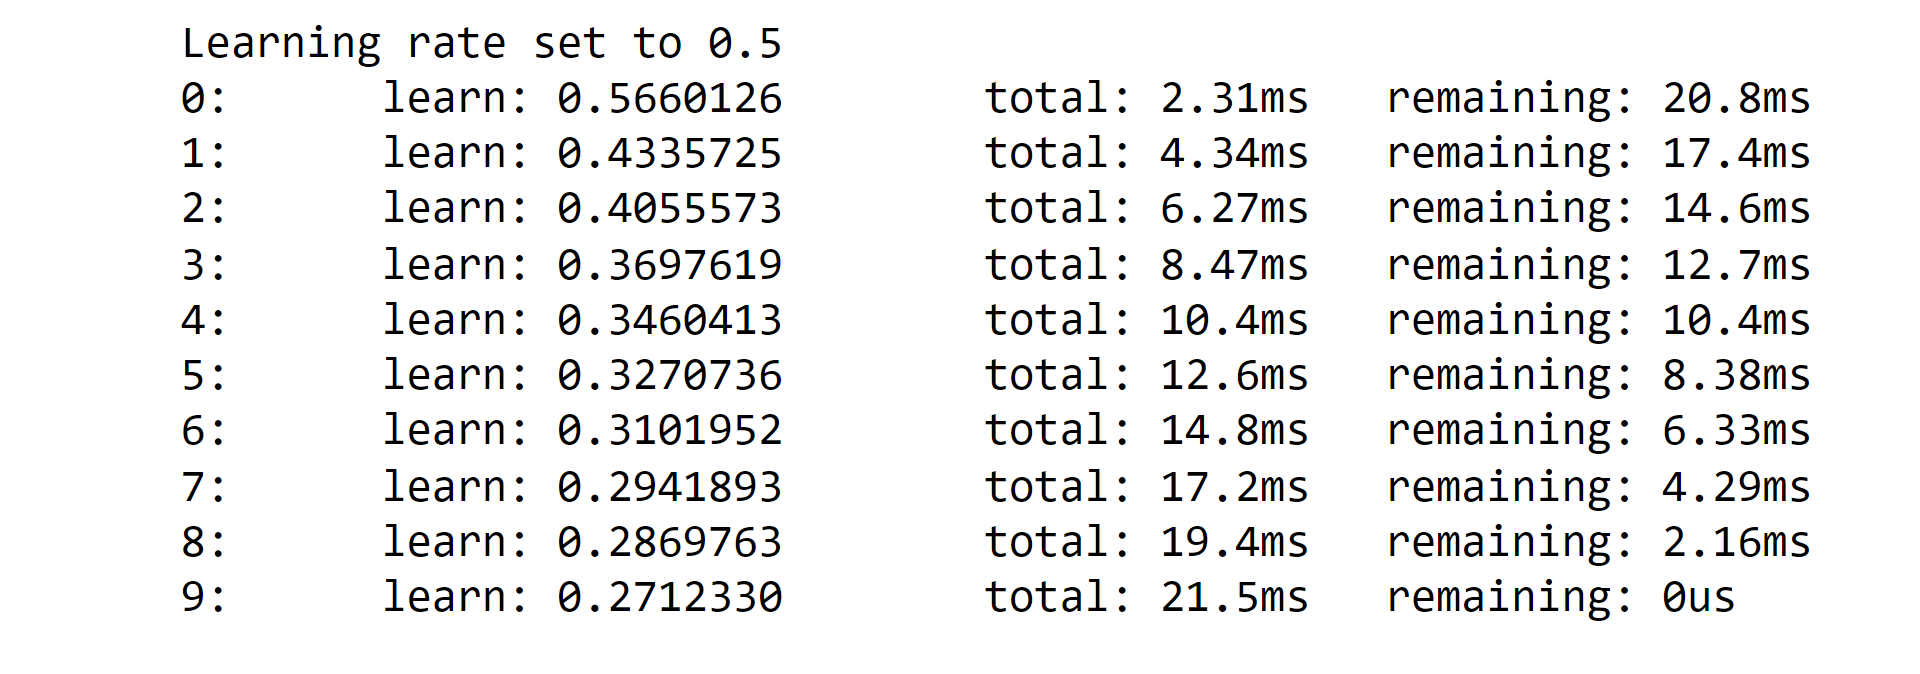
Output: 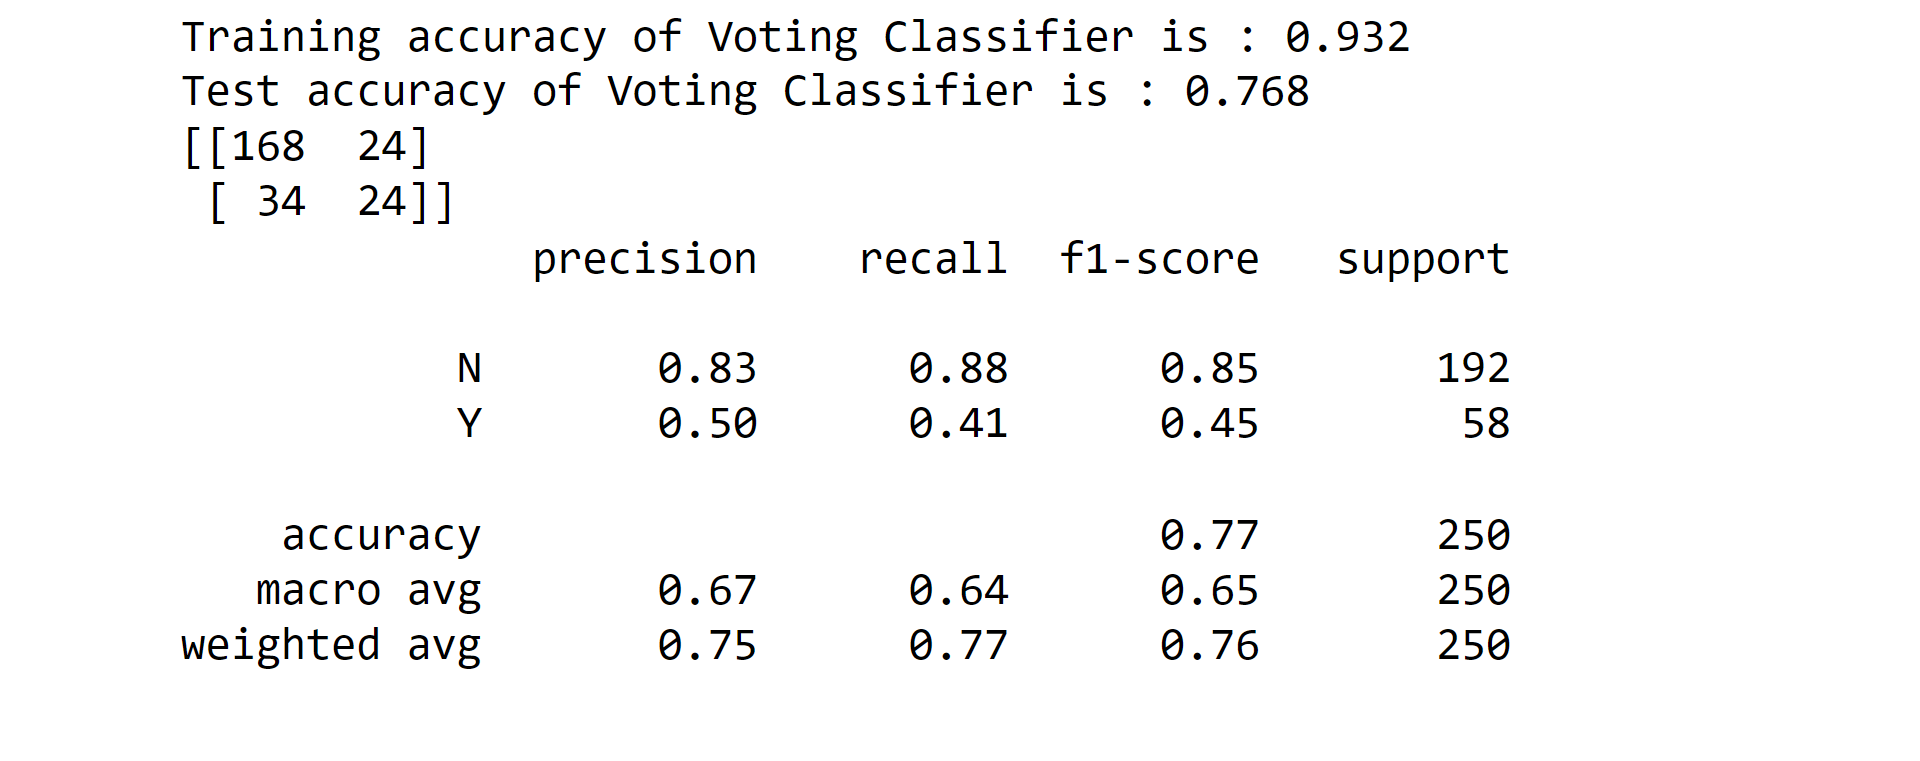
Comparing ModelsWe have already trained and tested our models, and now it's time to compare those So that we can find the most suitable for insurance fraud detection. Output: 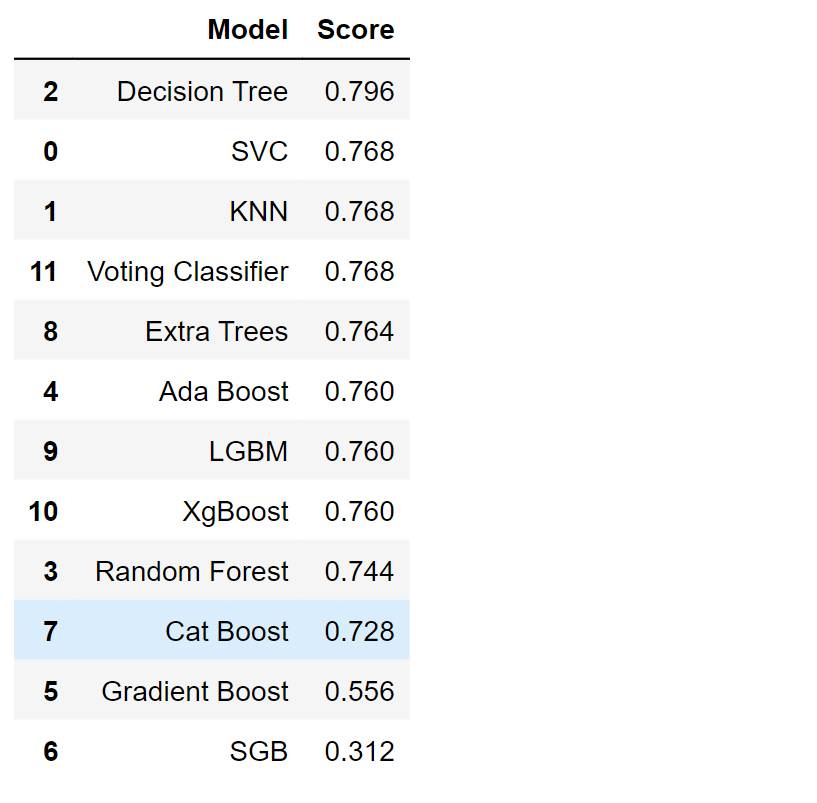
Decision Tree Classifier has the highest performance rate of 79%, and on the other hand, Stochastic Gradient Boosting (SGB) has the lowest performance rate of 31%. For this, we can say that DTC is one of the best models for insurance fraud detection.
Output: 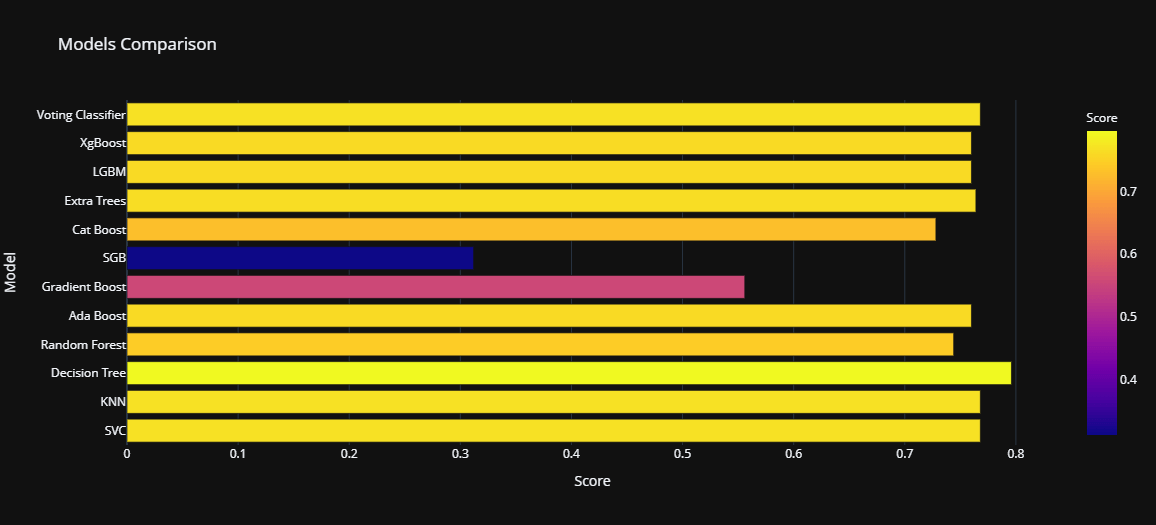
ConclusionInsurance fraud is a severe issue that can negatively affect insurance providers and their clients. By locating patterns and abnormalities in the data, machine learning algorithms may be utilized to detect and stop fraud. To guarantee the accuracy and efficiency of the model, it is crucial to select the appropriate method and manage the unbalanced nature of the data. Keep that in mind; we need to be very selective while opting for the model, as it will have a greater impact on the prediction.
Next TopicNPS in Machine Learning
|
 For Videos Join Our Youtube Channel: Join Now
Feedback
- Send your Feedback to [email protected]
Help Others, Please Share


