| |

Zillow Home Value (Zestimate) Prediction in MLWhat is Machine Learning:Machine learning (ML) is a field of referencing obliged understanding and building frameworks that "learn" - that is. These strategies influence information to engage execution on some arrangement of attempts other than. They help see the primary business questions and the data to answer them. A few executions of recreated insight use data and reproduced knowledge affiliations such a lot that it copies the working of a brand name artificial consciousness. In its application across business issues, PC-based information is, in like manner, recommended as a farsighted evaluation. Counterfeit information is an enormous piece of the making field of information science. Utilizing quantifiable systems, computations are prepared to make groupings or suppositions and uncover key data bits in information mining projects. These snippets of data drive dynamic inside applications and affiliations in a perfect world affecting basic improvement assessments. As huge measures of information proceed to create and made, the market pay for information inspectors will increase. They ought to assist with seeing the most authentic business questions and the information to respond to them. Mimicked insight computations are consistently caused using frameworks that accelerate plan upgrades, for example, TensorFlow and PyTorch. Learning assessments work on explaining that frameworks, algorithms, and allowances that worked exceptionally in the past will keep working wonderfully from this point forward. The discipline of artificial intelligence utilizes different approaches to overseeing help PCs achieve undertakings where no lovely assessment is open. In conditions where enormous measures of potential responses exist, one procedure is to name a piece of the right responses as huge. This can then be utilized to prepare information for the PC to work on the algorithm(s) it uses to pick the right responses. For instance, to set up a framework for the errand of motorized character confirmation, the MNIST dataset of deciphered digits has consistently been utilized. Model Optimization Algorithm:If the model can fit better to the information of interest in the readiness set, loads are changed to reduce the blunder between the known model and the model check. The computation will reiterate this "survey and get to the next level" process, reviving burdens freely until an edge of precision has been met. Machine learning Algorithms:Various MACHINE LEARNING algorithms are usually utilized. These may include:
In this tutorial, we will attempt to execute a house cost record small-scale PC that upset the whole land industry in the US. This will be a relapse task in which we have been given algorithm contrasts between the genuine and the expected costs of those homes by utilizing a benchmark model. Importing Libraries and DatasetPython libraries simplify dealing with information and perform commonplace and complex undertakings with a solitary line of code. Pandas:Panda is an open-source library that is made, for the most part, for working with social or marked information both effectively and naturally. It gives different information designs and activities for controlling mathematical information and time series. This library is based on top of the NumPy library. Pandas is quick, and it has elite execution and efficiency for clients. Advantages:
NumPy:NumPy is a generally helpful show taking care of groups, giving a world-class presentation of a multi-layered bunch of things and gadgets for working with these displays. It is the essential pack for consistent enlisting with Python. Besides its irrefutable intelligent purposes, NumPy can be used as a viable complex holder of nonexclusive data. A group in NumPy is a table of parts (by and large numbers), the sum of a comparable sort, recorded by a tuple of positive numbers. In NumPy, a few parts of the bunch are known as the place of the cluster. A tuple of numbers giving the display size along every viewpoint is known as the condition of the show. A group class in NumPy is called ndarray. Parts in NumPy shows are gotten to by square segments and can be presented using settled Python Records. Matplotlib:Matplotlib is a great portrayal library in Python for 2D plots of bunches. Matplotlib is a multi-stage data portrayal library given NumPy groups and is planned to work with the greater SciPy stack. It was introduced by John Tracker in the year 2002. One of the most mind-blowing benefits of discernment is that it grants us visual permission to epic proportions of data in successfully eatable visuals. Matplotlib includes a couple of plots like line, bar, scatter, histogram, etc. XGBoost:XGBoost is the most notable supporting calculation. It is striking for appearing at further developed courses of action when stood out from other artificial intelligence Calculations for gathering and backslide tasks. XGBoost, or Silly Slant Aiding, is an open-source library. Its unique codebase is in C++; notwithstanding, the library is gotten together with a Python interface. It helps us achieve a somewhat unrivaled show execution of tendency upheld Choice trees, can look like calculations, and is easy to do. How are Zillow Worth Forecasts determined:To get a handle on Zillow Home Evaluation Figures, you first need to comprehend the Zillow Home Appraisal Summary, which is still in the air. The Zillow Home Evaluation Once-over is the middle worth a sturdy spot to stay for an area. For instance, check out your space's Zillow Back Home Evaluation Record. The Zillow Home Evaluation Record is open for, by a wide margin, the novel geographic district, including states, metropolitan locales, regions, neighborhoods, and Postal divisions. The Zillow Home Evaluation Record can be utilized to look at the, by and large, normal worth of a home in one district versus another region. For instance, you should perceive how your local stacks up separated and different districts in your city. In this way, the Zillow Home Evaluation Record can be utilized to follow the middle worth of homes in a district long haul. You can research the rate change of the home evaluations in your space over the past month, quarter, or year. What is the Zillow Home Estimation Figure: The Zillow Home Assessment Figure is Zillow's gauge of what the Zillow Home Assessment Document will be one year from now, and it extends the Zillow Home Assessment Record one year into what will come. The Zillow Home Assessment Figure is just an assumption, as we are still figuring out what will happen in the year. Might you, at any point, give me a model: We should recognize Seattle. The February 2017 Zillow Home Evaluation Report for Seattle's single-family townhouse suites and center homes is $624,700, and the Zillow Home Appraisal Check for February 2018 is $648,000, an increase of 3.8 percent. In like manner, Zillow surmises that the middle home appraisal in Seattle will expand by 3.8 percent all through the following year. Is the Zillow Home Estimation Gauge accessible for my area: The Zillow Home Assessment Figure is available for most areas for which the Zillow Home Assessment Document is open. Like the Zillow Home Assessment Document, a figure is made for geographic breakdowns, including focus-based genuine locales (CBSAs), states, metropolitan networks, neighborhoods, and Postal divisions. How would you make the Zillow Home Estimation Conjecture: The Zillow Home Evaluation Surmise uses a quantifiable model utilizing different financial information. The model considers cash-related and staying information that could impact future home evaluations. For instance, a lower contract rate decreases the expense of a home, raising the premium. This will ultimately increase in-home evaluations since additional purchasers see a tantamount lodging supply. Precisely what data do you use to make the Zillow Home Estimation Figure: We use the information on various lodging pointers and wide financial business areas. The lodging pointers incorporate the home development cost, close-by charge rate, improvement costs, number of void homes, subprime propels, level of delinquent ascribes, and supply of homes open. The overall monetary pointers recall the adjustment of family pay, individual improvement, and joblessness rate. How Might you Join every one of the Information to make a Gauge: That is where the irrefutable model comes in. We use history to "train" the model to determine what will come. The genuine model must be clarified, including econometrics and time series outline methodologies. The subtleties of reasoning can be tracked down in this appraisal brief. How Precise are the Estimates:Financial estimating attempts to predict what is to come. This can be hard, especially when unexpected events impact the economy and the housing business focus. Regardless, amid reliability, the measures give a reasonable estimate of what will happen. For example, the check for Redding, CA, is for home assessments to augment by 10.7 percent from November 2012 to November 2013. Throughout ongoing years, the centre gauge botch for Redding, CA, which crosses the housing win and fall flat, is 3.4 percent. From 2014-2015, when values have been steadier, the centre gauge botch is essentially 2.8 percent. Aside from surprising events, we can reasonably anticipate values in Redding, CA, to augment between 7.7 percent and 13.7 percent. See here for extra bits of knowledge concerning gauge precision. When is the Zillow Home Estimation Conjecture Refreshed:The Zillow Home Estimation Conjecture is delivered around the month's center simultaneously, and we update the Zillow Home Estimation Record. Example: We should stack the dataset into the panda's information edge and print its initial five columns. Example: Presently how about we take a look at the size of the dataset? Example: Output: (91409, 60) The dataset contains many highlights; however, we can see invalid qualities too. Thus, before playing out any of the examinations, how about we clean the information first? What is Data Cleaning:The information from the essential sources is named crude information and requires a ton of pre-processing before we can get any ends from it or demonstrate it. Those pre-processing steps are known as information cleaning, and it incorporates anomalies expulsion, invalid worth attribution, and eliminating disparities of any kind in the information inputs. Example: Output: 45 Thus, in all out, 30 segments contain either exceptional qualities equivalent to 1 or have around 60% of the columns as invalid qualities. Example: We should look at which dataset segment contains which sort of information. Example: From the above code line, we will get the overall description of the dataset, including the column name, count, and data type. Here we can see that there are, as yet, invalid qualities in various sections of the dataset. Thus, we should check for the invalid qualities in the information outline and credit them by involving the mean incentive for the consistent factors and the mode an incentive for the clear-cut segments. We plot the graph using the dataset's data by matplotlib module Output: 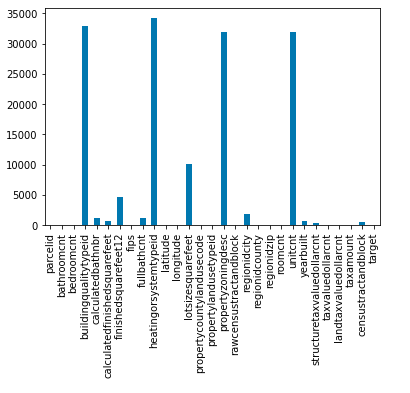
Output: 10 Exploratory Data Analysis:EDA is a way to deal with breaking down information utilizing visual strategies. It is utilized to find patterns and examples or to look at suppositions with measurable outlines and graphical portrayals. Output: (4, 40, 2) The quantity of interesting qualities is excessively high to envision else. We might have plotted a count plot for these unmitigated segments. Example: Output: 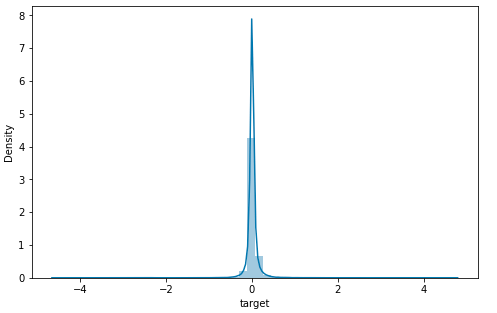
From the above dissemination plot of the objective variable, it appears there are anomalies in the information. We should utilize a boxplot to identify them. Output: 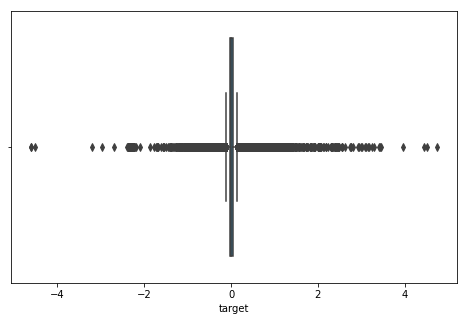
From the above box plot, we can cut the objective qualities between - 1 to 1 for feasible(only on designs) model preparation. Example: Output: The Shape of the data frame before the evacuation of exceptions (91300, 45) The Shape of the data frame after the evacuation of exceptions (90896, 45) This implies that we maintain that much focus. Presently how about we check regardless of whether there are any profoundly related highlights in our dataset? Example: Output: 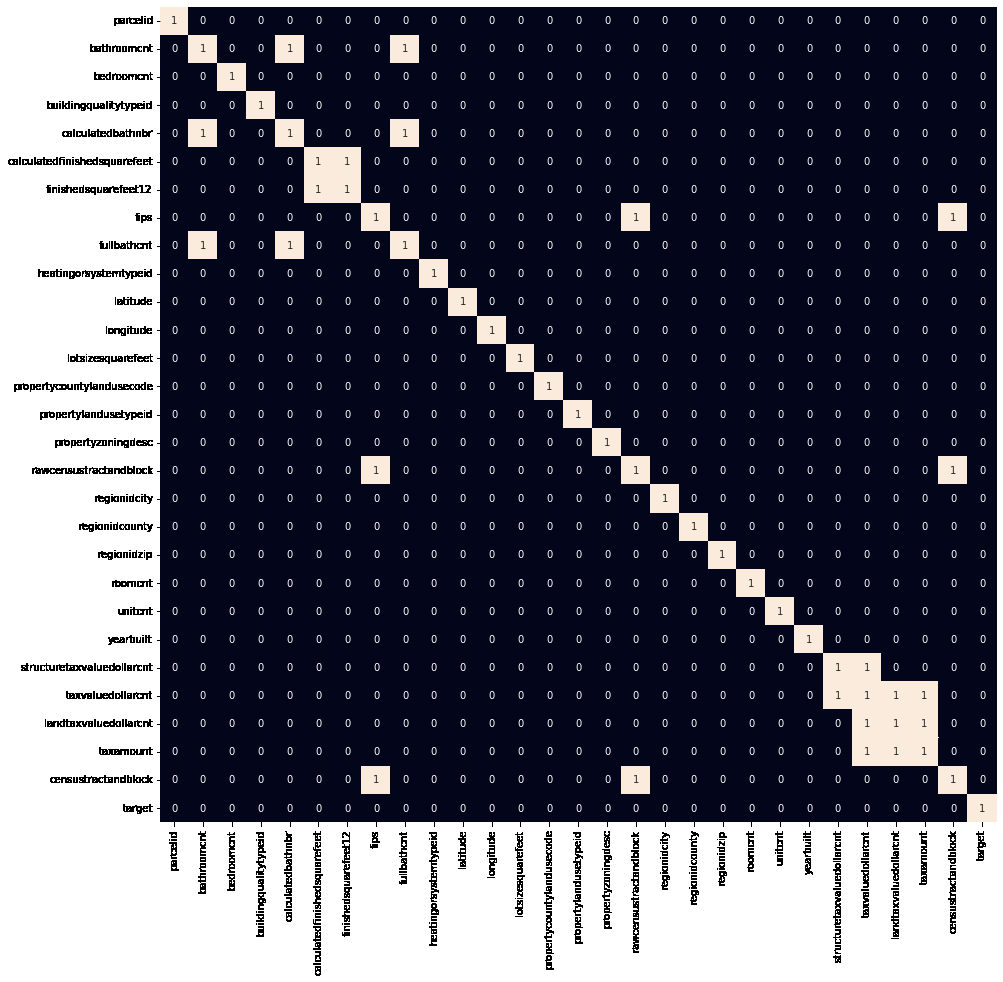
Heat guide to tracking down profoundly corresponded highlights. Unquestionably, there are a few exceptionally connected highlights in the component space. We will eliminate them to diminish the information's intricacy and avoid any instances of blunder. How to Train the Model:We will divide the highlights and target factors into preparing and testing information. We will choose the model performing best on the approval information. Output: (88024, 21), (9024, 21)) Normalizing the information before taking care of it into AI models assists us with accomplishing steady and quick preparation. We have divided our information into preparing and approving information; additionally, the standardization of the information has been finished. How about we train cutting-edge AI models and select the best from them utilizing the approval dataset? Example: Output: Linear Regression() : Preparing Blunder: 6.615973946859e-17 Approval Blunder: 6.708349655426e-17 XGB Regressor() : Preparing Blunder: 0.0010633639062428 Approval Blunder: 0.0010845248796474 Rope() : Preparing Blunder: 0.06199753224405 Approval Blunder: 0.06211054490276 Random Forest Regressor(): Preparing Blunder: 5.433845241515e-06 Approval Blunder: 1.25409161664197e-05 Ridge() : Preparing Blunder: 7.7050246902485e-07 Approval Blunder: 7.7294240666734e-07 You could ponder the explanation for this low good respect. The justification behind this is the real objective worth. The objective qualities differ between the veritable logarithm and the normal house cost values. Considering this, the attributes are all present to the degree of - 1 to 1; consequently, this prompts even lower mishandling values. |
 For Videos Join Our Youtube Channel: Join Now
Feedback
- Send your Feedback to [email protected]
Help Others, Please Share


