K-Nearest Neighbor(KNN) Algorithm for Machine Learning
- K-Nearest Neighbour is one of the simplest Machine Learning algorithms based on Supervised Learning technique.
- K-NN algorithm assumes the similarity between the new case/data and available cases and put the new case into the category that is most similar to the available categories.
- K-NN algorithm stores all the available data and classifies a new data point based on the similarity. This means when new data appears then it can be easily classified into a well suite category by using K- NN algorithm.
- K-NN algorithm can be used for Regression as well as for Classification but mostly it is used for the Classification problems.
- K-NN is a non-parametric algorithm, which means it does not make any assumption on underlying data.
- It is also called a lazy learner algorithm because it does not learn from the training set immediately instead it stores the dataset and at the time of classification, it performs an action on the dataset.
- KNN algorithm at the training phase just stores the dataset and when it gets new data, then it classifies that data into a category that is much similar to the new data.
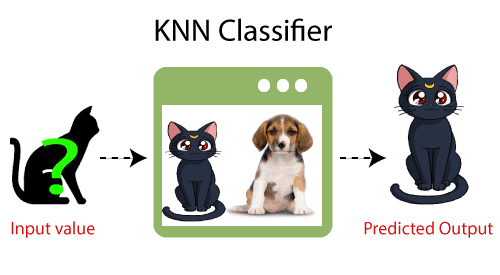
- Example: Suppose, we have an image of a creature that looks similar to cat and dog, but we want to know either it is a cat or dog. So for this identification, we can use the KNN algorithm, as it works on a similarity measure. Our KNN model will find the similar features of the new data set to the cats and dogs images and based on the most similar features it will put it in either cat or dog category.
Why do we need a K-NN Algorithm?
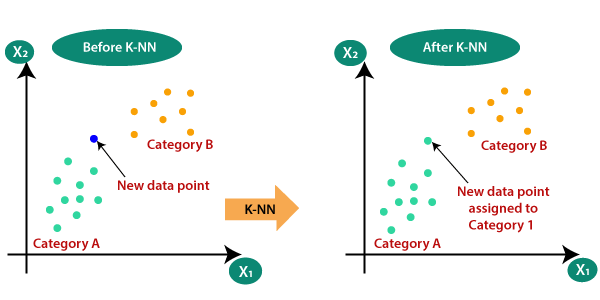
Suppose there are two categories, i.e., Category A and Category B, and we have a new data point x1, so this data point will lie in which of these categories. To solve this type of problem, we need a K-NN algorithm. With the help of K-NN, we can easily identify the category or class of a particular dataset. Consider the below diagram:
How does K-NN work?
The K-NN working can be explained on the basis of the below algorithm:
- Step-1: Select the number K of the neighbors
- Step-2: Calculate the Euclidean distance of K number of neighbors
- Step-3: Take the K nearest neighbors as per the calculated Euclidean distance.
- Step-4: Among these k neighbors, count the number of the data points in each category.
- Step-5: Assign the new data points to that category for which the number of the neighbor is maximum.
- Step-6: Our model is ready.
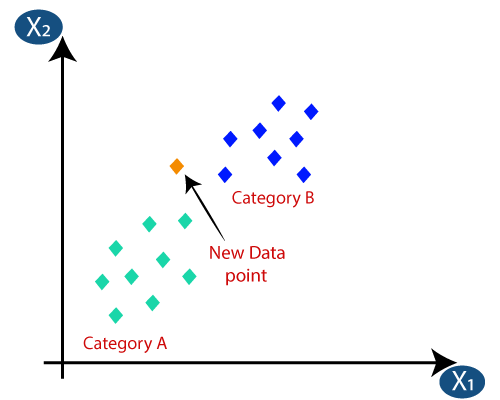
Suppose we have a new data point and we need to put it in the required category. Consider the below image:
- Firstly, we will choose the number of neighbors, so we will choose the k=5.
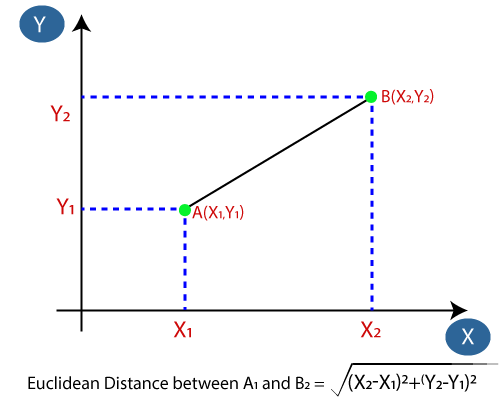
- Next, we will calculate the Euclidean distance between the data points. The Euclidean distance is the distance between two points, which we have already studied in geometry. It can be calculated as:
- By calculating the Euclidean distance we got the nearest neighbors, as three nearest neighbors in category A and two nearest neighbors in category B. Consider the below image:
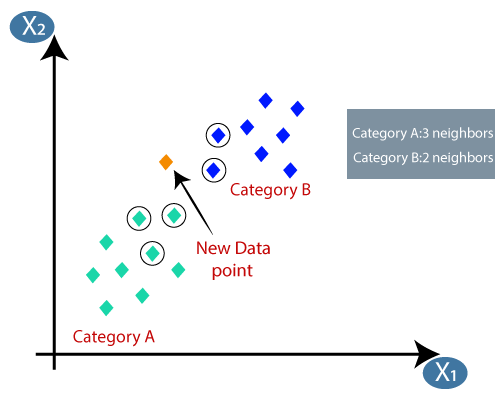
- As we can see the 3 nearest neighbors are from category A, hence this new data point must belong to category A.
How to select the value of K in the K-NN Algorithm?
Below are some points to remember while selecting the value of K in the K-NN algorithm:
- There is no particular way to determine the best value for "K", so we need to try some values to find the best out of them. The most preferred value for K is 5.
- A very low value for K such as K=1 or K=2, can be noisy and lead to the effects of outliers in the model.
- Large values for K are good, but it may find some difficulties.
Advantages of KNN Algorithm:
- It is simple to implement.
- It is robust to the noisy training data
- It can be more effective if the training data is large.
Disadvantages of KNN Algorithm:
- Always needs to determine the value of K which may be complex some time.
- The computation cost is high because of calculating the distance between the data points for all the training samples.
Python implementation of the KNN algorithm
To do the Python implementation of the K-NN algorithm, we will use the same problem and dataset which we have used in Logistic Regression. But here we will improve the performance of the model. Below is the problem description:
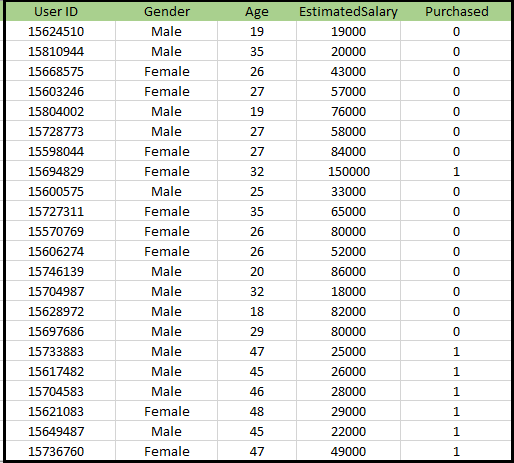
Problem for K-NN Algorithm: There is a Car manufacturer company that has manufactured a new SUV car. The company wants to give the ads to the users who are interested in buying that SUV. So for this problem, we have a dataset that contains multiple user's information through the social network. The dataset contains lots of information but the Estimated Salary and Age we will consider for the independent variable and the Purchased variable is for the dependent variable. Below is the dataset:
Steps to implement the K-NN algorithm:
- Data Pre-processing step
- Fitting the K-NN algorithm to the Training set
- Predicting the test result
- Test accuracy of the result(Creation of Confusion matrix)
- Visualizing the test set result.
Data Pre-Processing Step:
The Data Pre-processing step will remain exactly the same as Logistic Regression. Below is the code for it:
By executing the above code, our dataset is imported to our program and well pre-processed. After feature scaling our test dataset will look like:
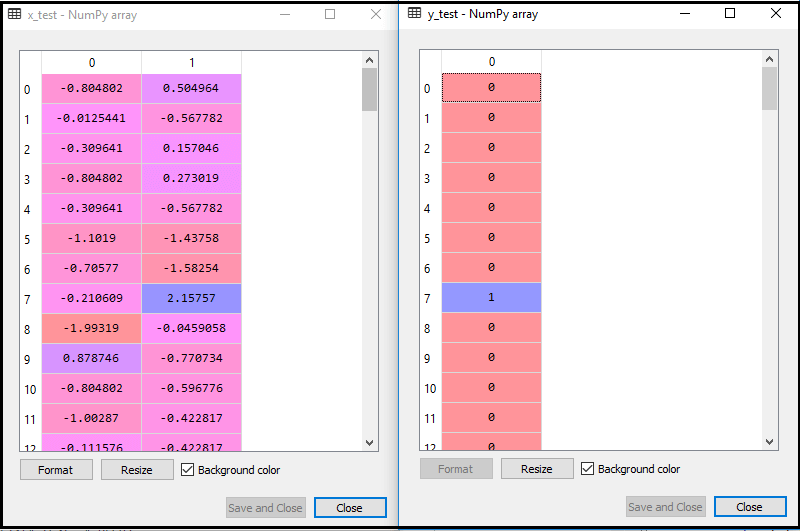
From the above output image, we can see that our data is successfully scaled.
- Fitting K-NN classifier to the Training data:
Now we will fit the K-NN classifier to the training data. To do this we will import the KNeighborsClassifier class of Sklearn Neighbors library. After importing the class, we will create the Classifier object of the class. The Parameter of this class will be
- n_neighbors: To define the required neighbors of the algorithm. Usually, it takes 5.
- metric='minkowski': This is the default parameter and it decides the distance between the points.
- p=2: It is equivalent to the standard Euclidean metric.
And then we will fit the classifier to the training data. Below is the code for it:
Output: By executing the above code, we will get the output as:
Out[10]:
KNeighborsClassifier(algorithm='auto', leaf_size=30, metric='minkowski',
                     metric_params=None, n_jobs=None, n_neighbors=5, p=2,
                     weights='uniform')
- Predicting the Test Result:
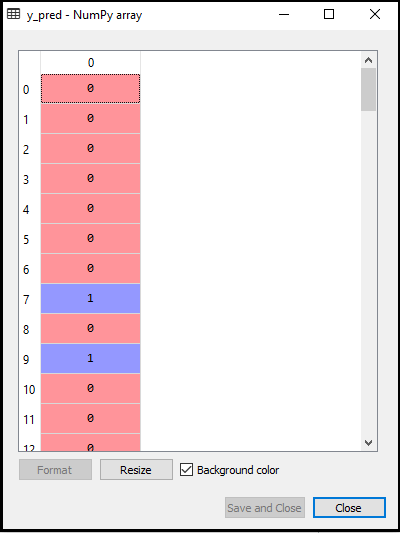
To predict the test set result, we will create a y_pred vector as we did in Logistic Regression. Below is the code for it:
Output:
The output for the above code will be:
- Creating the Confusion Matrix:
Now we will create the Confusion Matrix for our K-NN model to see the accuracy of the classifier. Below is the code for it:
In above code, we have imported the confusion_matrix function and called it using the variable cm.
Output: By executing the above code, we will get the matrix as below:
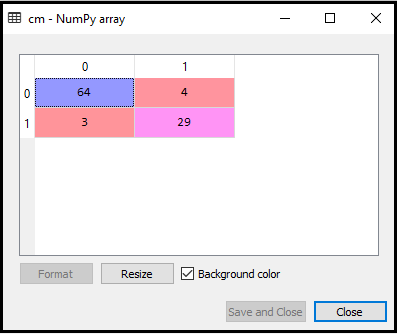
In the above image, we can see there are 64+29= 93 correct predictions and 3+4= 7 incorrect predictions, whereas, in Logistic Regression, there were 11 incorrect predictions. So we can say that the performance of the model is improved by using the K-NN algorithm.
- Visualizing the Training set result:
Now, we will visualize the training set result for K-NN model. The code will remain same as we did in Logistic Regression, except the name of the graph. Below is the code for it:
Output:
By executing the above code, we will get the below graph:
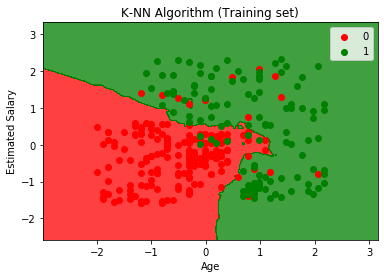
The output graph is different from the graph which we have occurred in Logistic Regression. It can be understood in the below points:
- As we can see the graph is showing the red point and green points. The green points are for Purchased(1) and Red Points for not Purchased(0) variable.
- The graph is showing an irregular boundary instead of showing any straight line or any curve because it is a K-NN algorithm, i.e., finding the nearest neighbor.
- The graph has classified users in the correct categories as most of the users who didn't buy the SUV are in the red region and users who bought the SUV are in the green region.
- The graph is showing good result but still, there are some green points in the red region and red points in the green region. But this is no big issue as by doing this model is prevented from overfitting issues.
- Hence our model is well trained.
- Visualizing the Test set result:
After the training of the model, we will now test the result by putting a new dataset, i.e., Test dataset. Code remains the same except some minor changes: such as x_train and y_train will be replaced by x_test and y_test.
Below is the code for it:
Output:

The above graph is showing the output for the test data set. As we can see in the graph, the predicted output is well good as most of the red points are in the red region and most of the green points are in the green region.
However, there are few green points in the red region and a few red points in the green region. So these are the incorrect observations that we have observed in the confusion matrix(7 Incorrect output).
|

 For Videos Join Our Youtube Channel: Join Now


