| |

Titanic- Machine Learning From Disaster
The tragic incident of the Titanic's sinking in 1912 stands as a poignant historical maritime catastrophe. Beyond the tragedy, the dataset associated with the Titanic has evolved into a pivotal resource for individuals engaged in the realms of data science and machine learning. In the following exploration, we will delve into the significance of the Titanic dataset as a valuable platform for those interested in machine learning, offering valuable lessons in aspects like data preparation, feature manipulation, and predictive modeling. It is considered a Beginner Level Dataset, So we will work on the Dataset on a very basic basis. Dataset DescriptionThe training dataset serves as the foundation for constructing your machine-learning models. Within this training dataset, the outcomes for each passenger, commonly referred to as the "ground truth," are provided. Your model's construction relies on various attributes, or "features," such as the passengers' gender and class. Additionally, the possibility of feature engineering exists, allowing for the creation of novel attributes. Data Glossary
Feature Elaboration
ChallengeThe challenge posed by the Titanic dataset is to predict which passengers survived the disaster based on various features such as their age, gender, class, and more. This challenge falls under the umbrella of supervised learning, as we have labeled data for the training set and aim to predict the labels for the test set. Code Implementation
First, we will look at what are the features that are in the Dataset. Output: 
Seems like we have a lot of attributes for our dataset. Then we need to classify these features, like which are categorical features and which are numerical features. Categorical Features: These values categorize the instances into groups of comparable instances. Categorical features consist of nominal, ordinal, ratio, or interval-based values. This aids in choosing suitable visualizations, among other purposes. Categorical: Survived, Sex, and Embarked. Ordinal: Pclass. Numerical Features: These values vary across different instances. Numerical features encompass discrete, continuous, or time-series-based values. This assists in determining suitable plots for visualization, among other uses. Continuous: Age, Fare. Discrete: SibSp, Parch. Output: 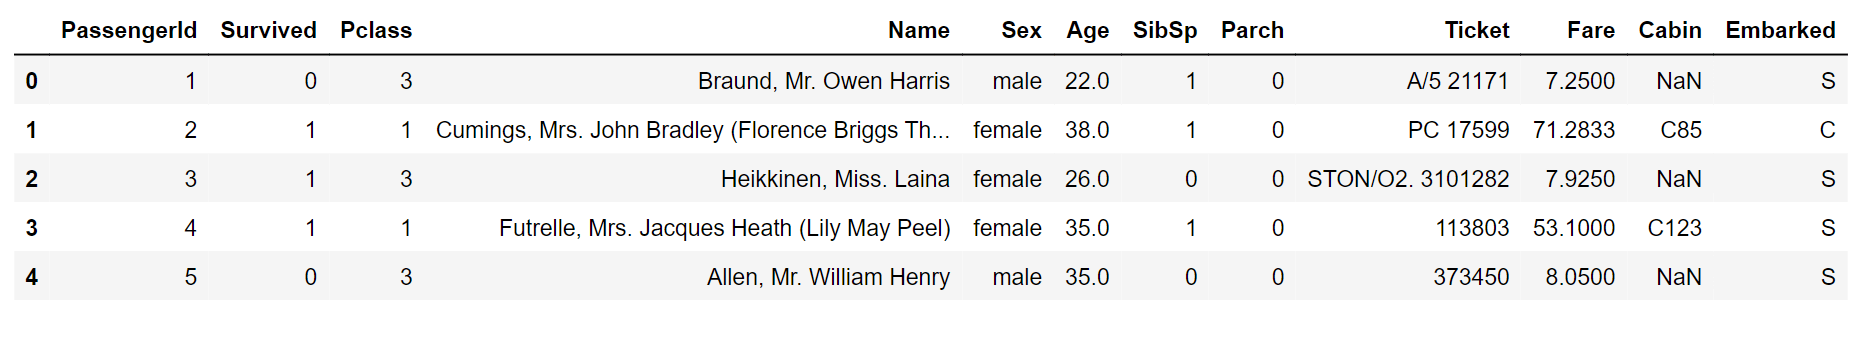
Mixed data types refer to the inclusion of both numeric and alphanumeric data within a single feature. These instances are potential candidates for corrective measures toward achieving the desired objective. We do have mixed data types in our dataset. Here, the ticket information comprises a combination of numeric and alphanumeric data types, while the cabin data consists solely of alphanumeric characters. Analyzing errors and typos within features can be more challenging in extensive datasets. However, examining a subset of samples from a smaller dataset might readily reveal the features that need rectification. Here, if you look carefully, the "Name" attribute could potentially include inaccuracies or typographical errors, as various formats are employed to represent names. These formats encompass titles, parentheses, and quotation marks, often utilized for alternate or abbreviated names. Output: 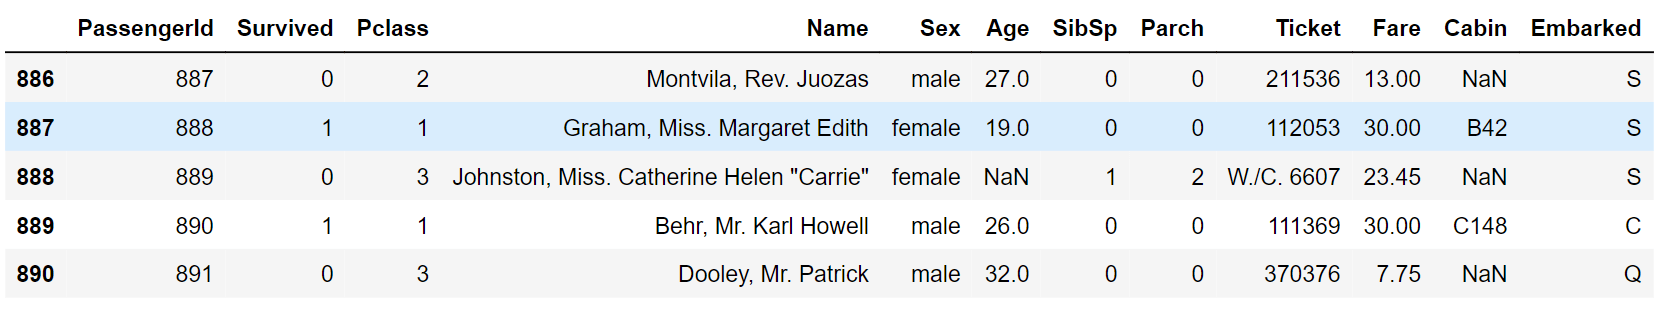
Output: 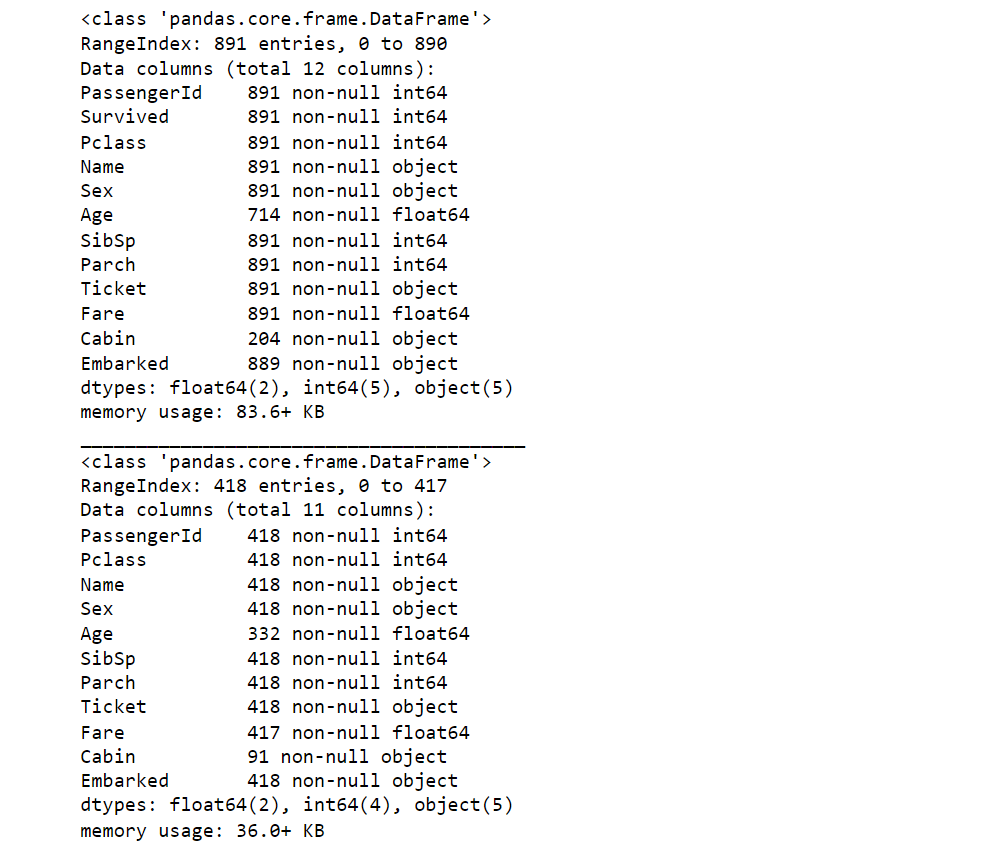
In the dataset, the "Cabin," "Age," and "Embarked" attributes exhibit a sequence of null values, ranked from highest to lowest occurrence. There are seven features with integer or float data types, and this count reduces to six in the case of the test dataset. Additionally, five features are represented as strings or objects. Output: 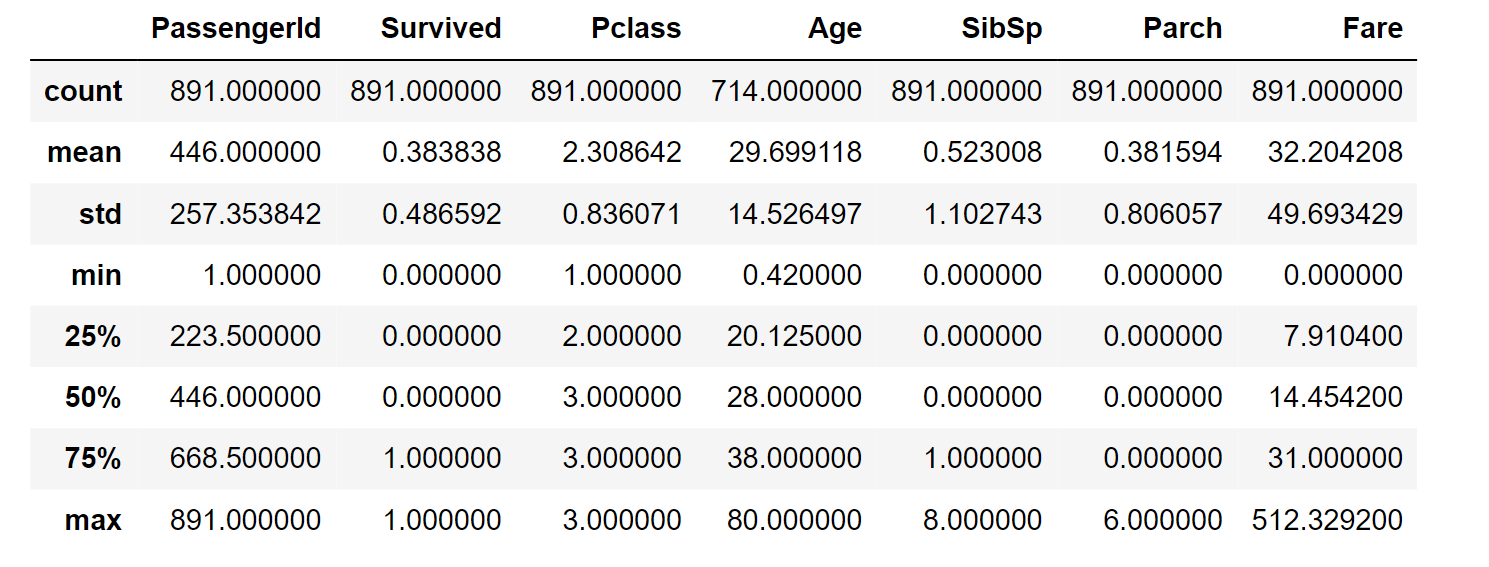
Let's look at the various distribution of numerical features:
Output: 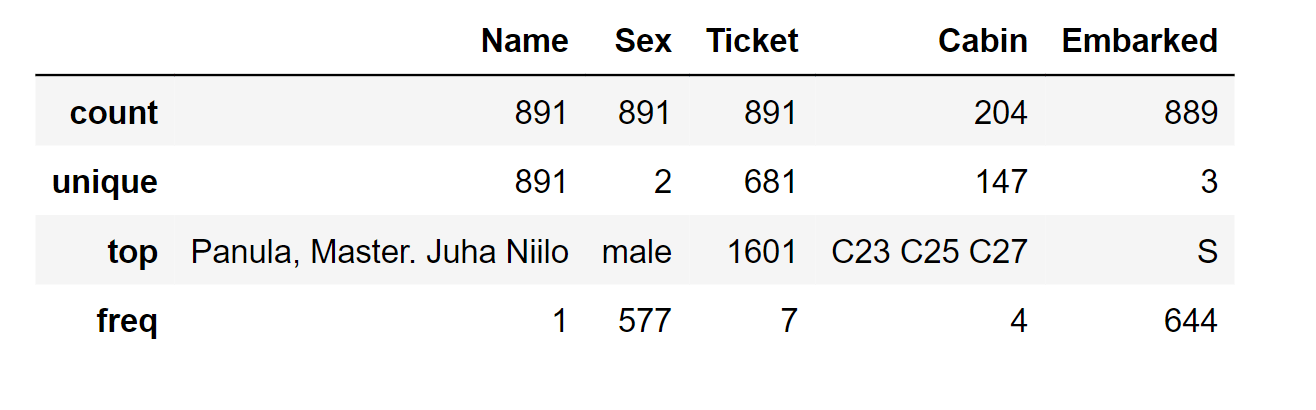
Let's look at the various distribution of categorical features:
Laying Down AssumptionsWe will establish hypotheses derived from the data analysis conducted thus far. We might also seek to further substantiate these hypotheses before making necessary decisions. The following are the assumptions:
Pivoting FeaturesWe can swiftly assess the correlations between our features by creating pivot tables that cross-reference different features. However, this analysis is currently limited to features without any missing values. Additionally, it's prudent to perform this analysis specifically for features that fall into categorical (Sex), ordinal (Pclass), or discrete (SibSp, Parch) types. Output: 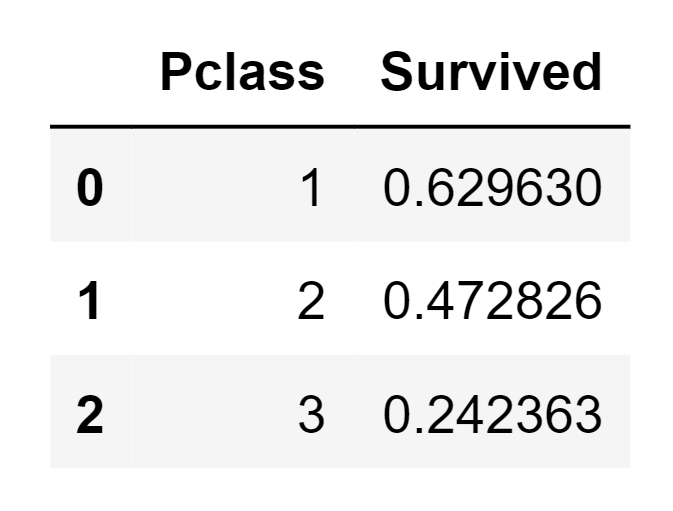
Output: 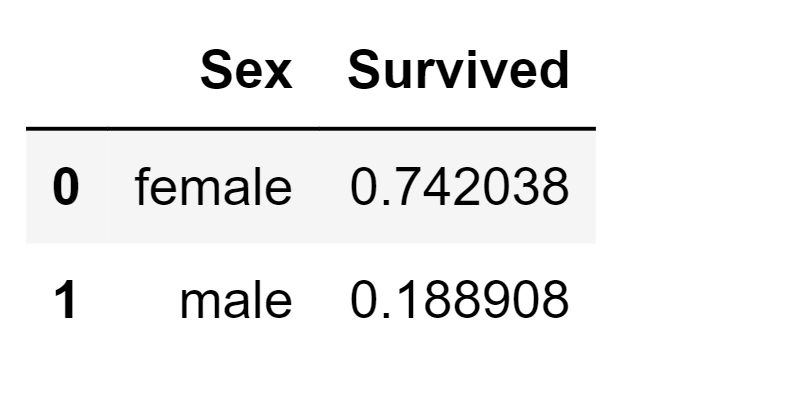
Output: 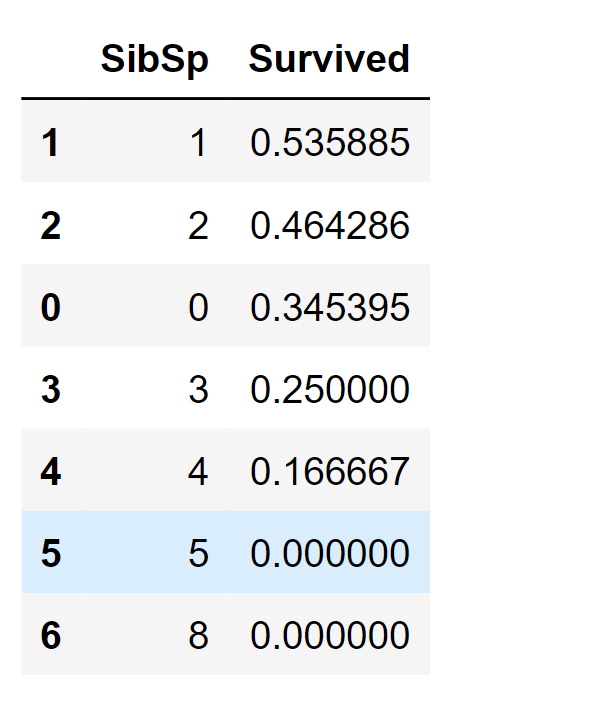
Output: 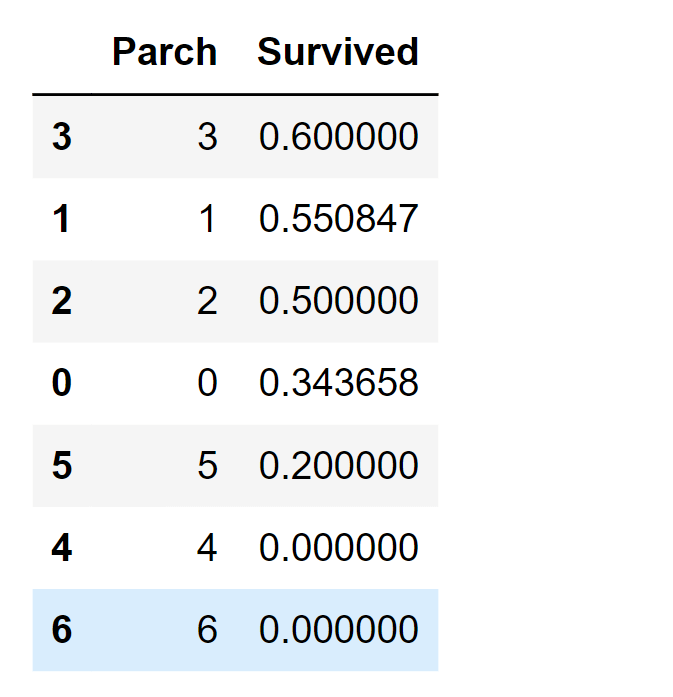
We can now proceed to validate certain assumptions by utilizing visualizations to analyze the data further. Correlation Between Numerical FeaturesWe will initiate our analysis by comprehending the correlations between numerical features and our desired outcome (Survived). Output: 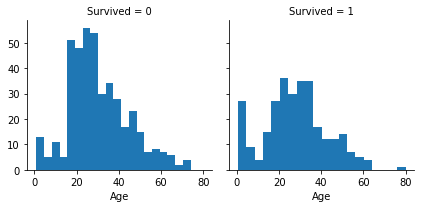
Upon careful examination of the data, the following observations were noted:
Consequently, the subsequent decisions were taken:
Correlation Between Numerical and Ordinal FeaturesWe have the ability to merge several features to detect correlations through a singular visualization. This approach is applicable to both numerical and categorical features that possess numeric values. Output: 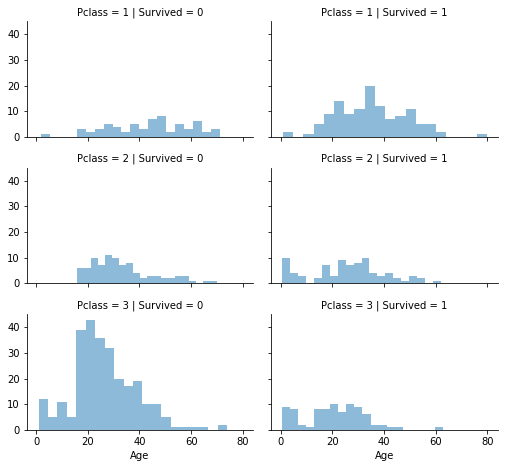
Upon careful examination of the data, the following observations were noted:
In light of these observations, the subsequent decision was taken:
Correlation Between Categorical FeaturesNext, we will establish correlations between categorical attributes and our objective for the solution. Output: 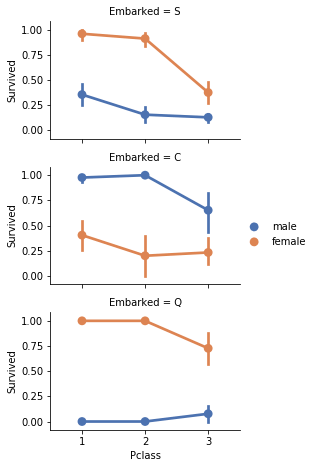
Upon careful examination of the data, the following observations were noted:
Consequently, the subsequent decisions were taken:
Correlation Between Categorical and Numerical FeaturesWe might also consider examining potential correlations between categorical features (with non-numeric values) and numeric features. For instance, we can explore the correlation between Embarked (a categorical non-numeric feature), Sex (another categorical non-numeric feature), Fare (a numeric continuous feature), and Survived (a categorical numeric feature). Output: 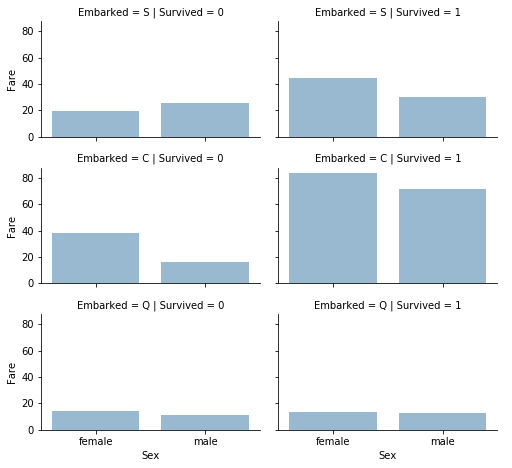
Upon careful examination of the data, the following observations were noted:
Consequently, the subsequent decisions were taken:
Data wrangling, also known as data munging or data preprocessing, is the process of cleaning, transforming, and organizing raw data into a more structured and usable format for analysis. It involves various tasks such as handling missing values, removing duplicates, formatting data, and merging data from different sources. Data wrangling ensures that the data is accurate, consistent, and ready for further analysis, making the overall data analysis process smoother and more effective. Dropping FeaturesBy removing features, we are working with a reduced set of data points. This accelerates our model's performance and simplifies the analysis. We intend to eliminate the Cabin and Ticket features. Output: 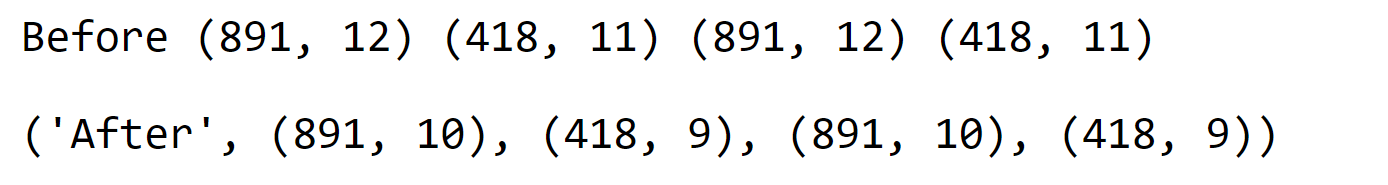
Creating New FeaturesWe aim to examine whether the Name feature can be manipulated to extract titles and then assess the connection between titles and survival rates. This analysis will be conducted before we decide to remove the Name and PassengerId features. Now, we will utilize regular expressions to extract the Title feature. The regular expression pattern (\w+\.) identifies the initial word followed by a dot character within the Name feature. By using the expand=False flag, we get a DataFrame as an output. Output: 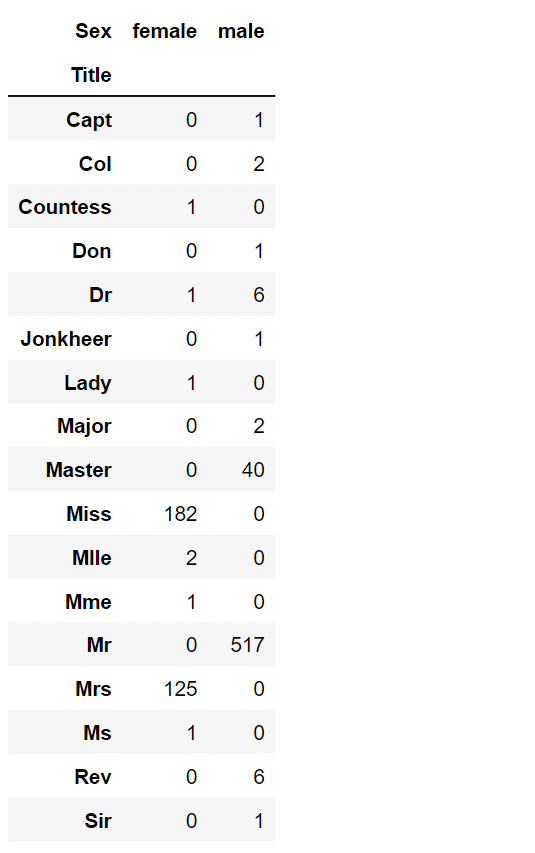
Upon careful examination of the data, the following observations were noted:
Consequently, the subsequent decisions were taken:
We have the option to substitute numerous titles with a more common name or categorize them as "Rare." Output: 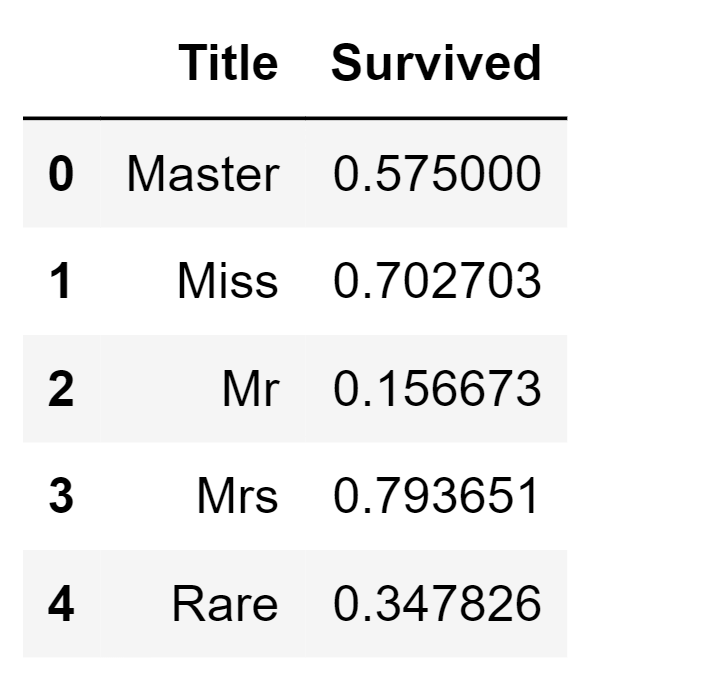
We can convert the categorical titles to ordinal. Output: 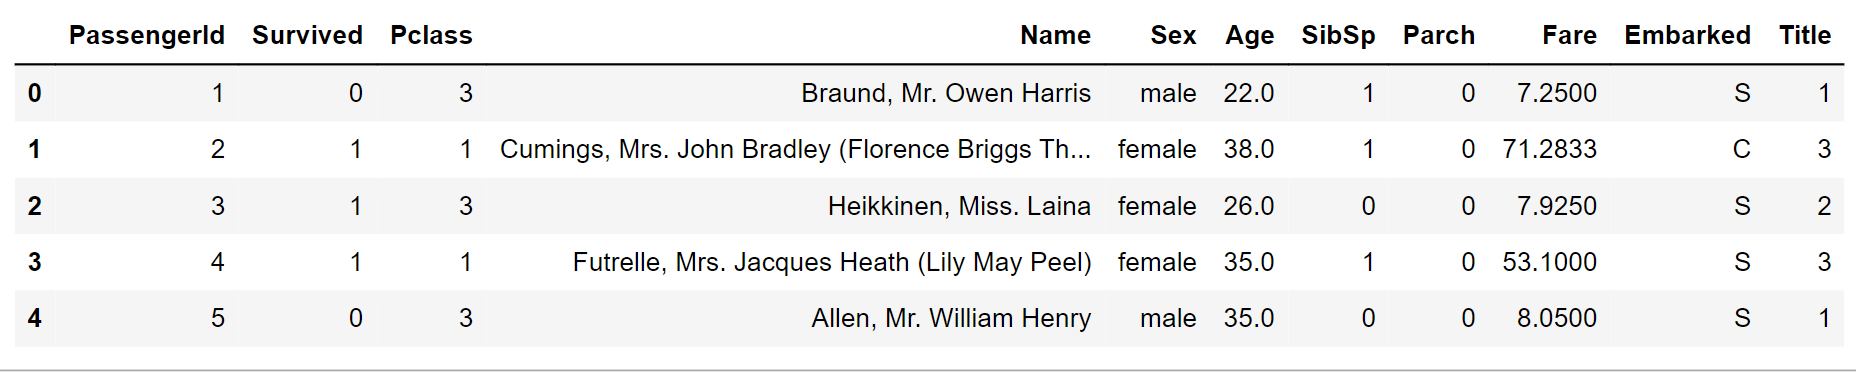
We can now confidently remove the Name feature from the datasets. Additionally, there is no requirement for the PassengerId feature in the dataset. Output: 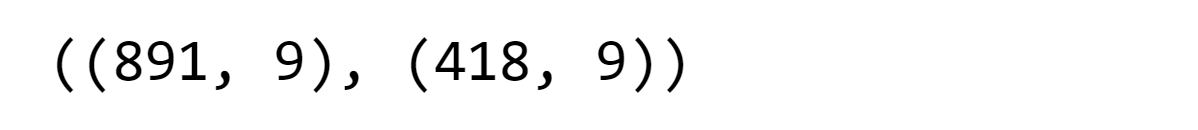
Converting Categorical FeatureWe can proceed with transforming features that hold string values into numerical ones, as most model algorithms necessitate this format. This conversion is also essential for accomplishing our feature completion objective. To initiate this process, we will transform the Sex feature into a new feature named Gender, where female corresponds to 1 and male to 0. Output: 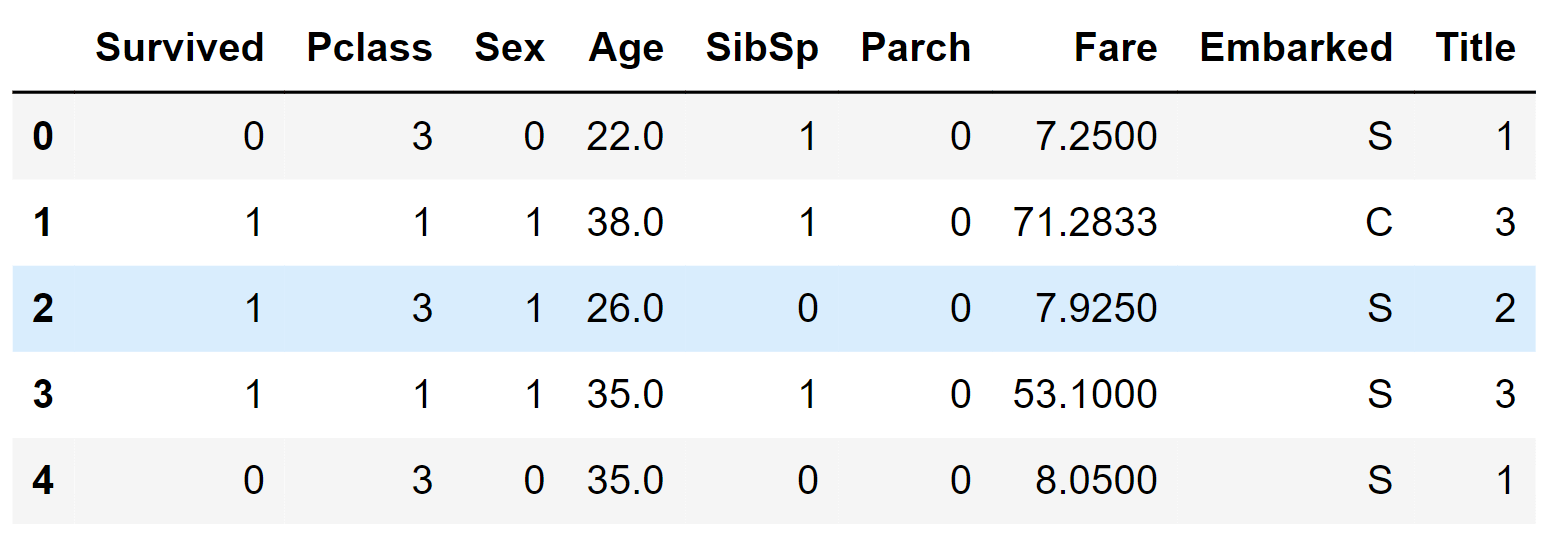
Continuous FeaturesNow, we need to commence the estimation and filling of features that have missing or null values. Let's initiate this process with the Age feature. There are three approaches we can consider to fill in missing values for a numerical continuous feature:
Both methods 1 and 3 can introduce random fluctuations into our models, leading to varying outcomes in multiple runs. Therefore, we will opt for method 2 as our preferred choice. Output: 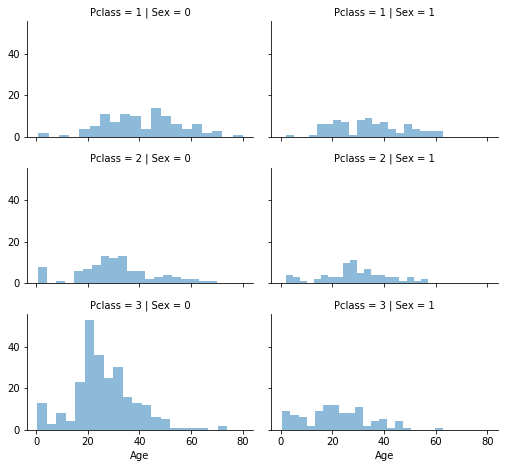
We'll initiate the process by creating an empty array to hold estimated Age values, which will be determined by combinations of Pclass and Gender. Output: 
Next, we'll loop through Gender (0 or 1) and Pclass (1, 2, 3) to compute estimated Age values for the six possible combinations. Output: 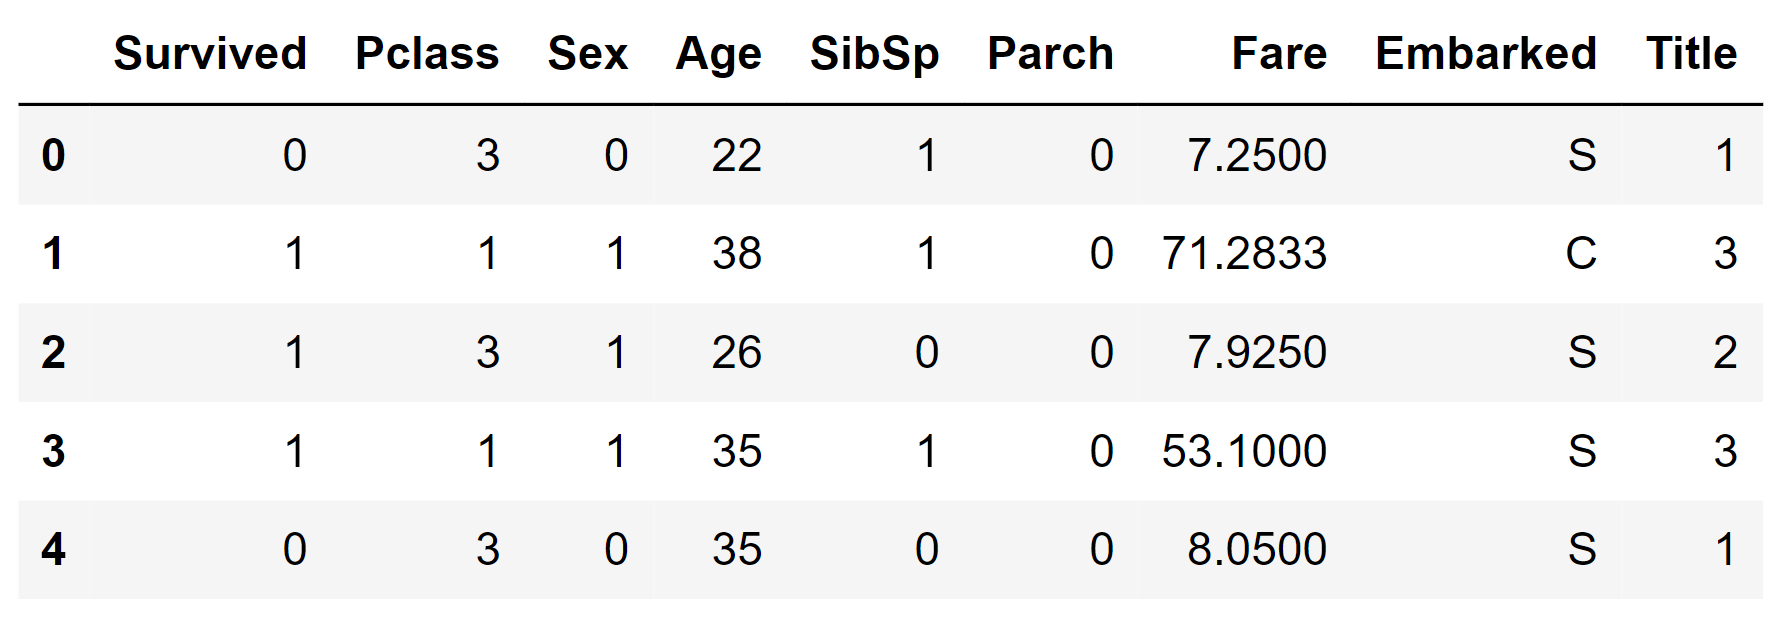
We'll establish age groups and assess their correlations with Survived. Output: 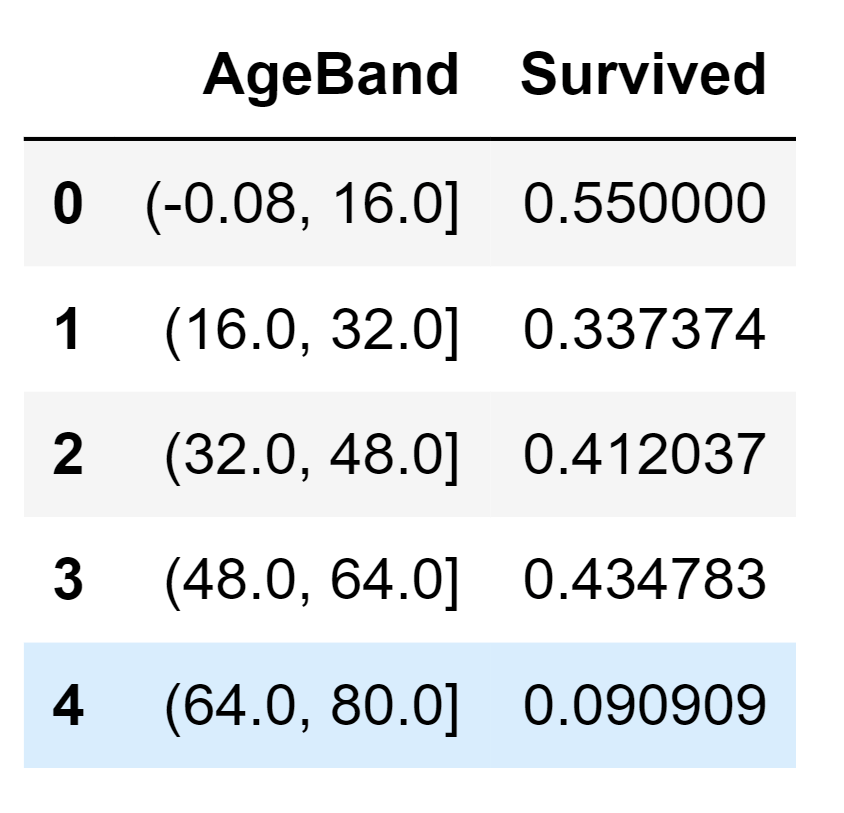
We will substitute Age values with ordinal numbers corresponding to these age groups. Output: 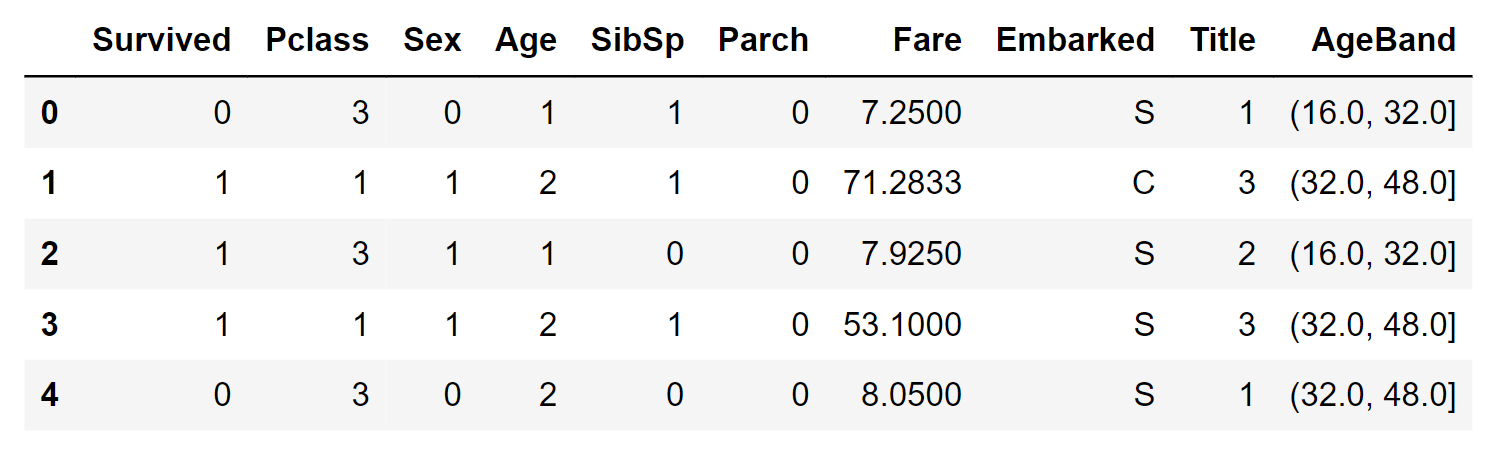
We can not remove the AgeBand feature. Output: 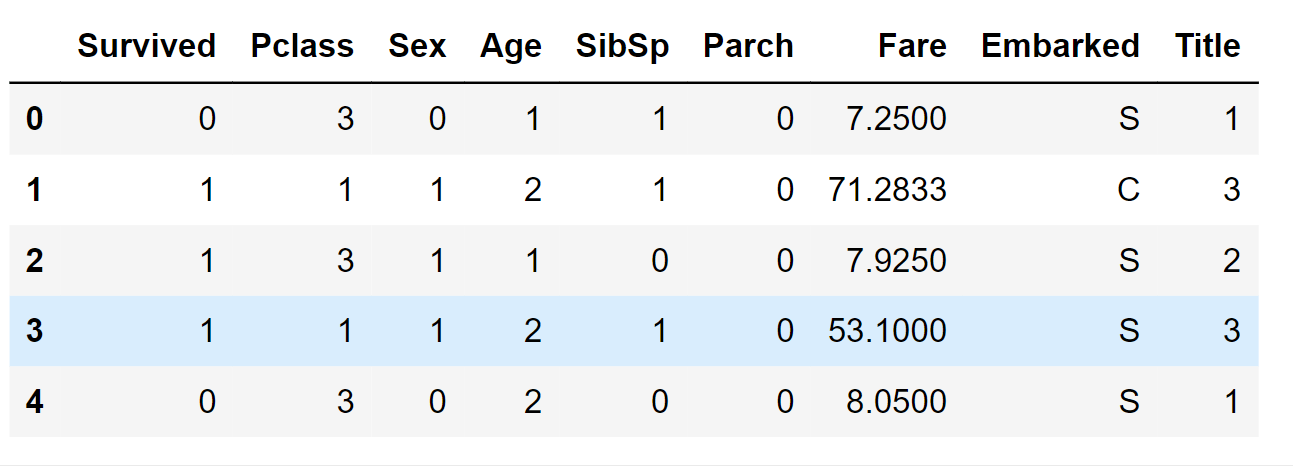
New Feature Through Existing FeaturesWe have the option to generate a fresh attribute called FamilySize by amalgamating Parch and SibSp. This would then allow us to remove Parch and SibSp from our datasets. Output: 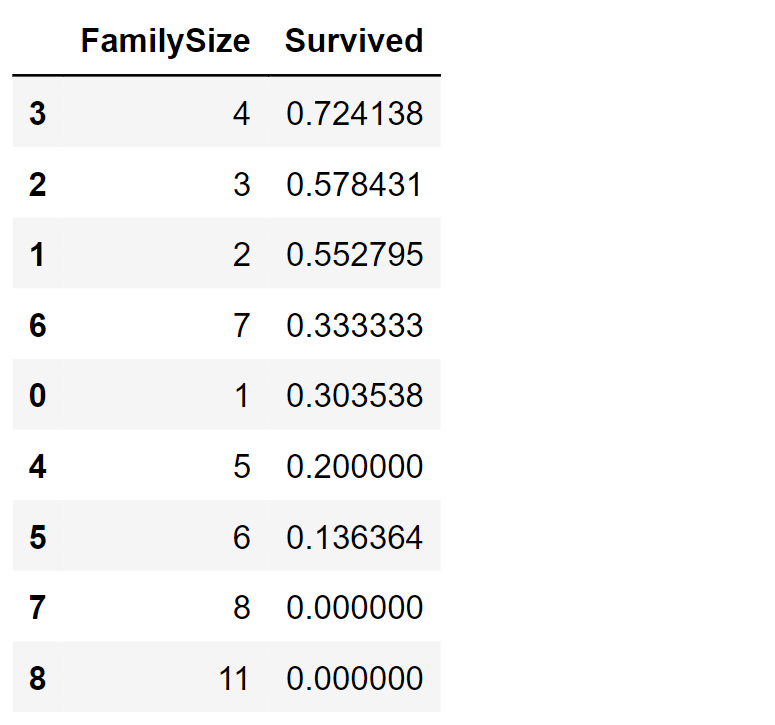
We have the opportunity to produce an additional attribute referred to as IsAlone. Output: 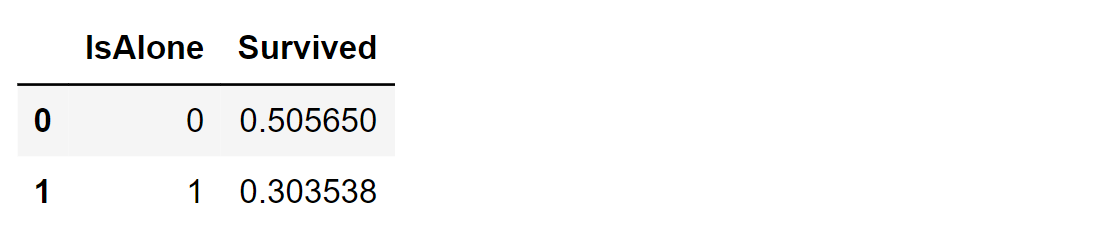
We should drop the Parch, SibSp, and FamilySize attributes and instead consider the IsAlone feature. Output: 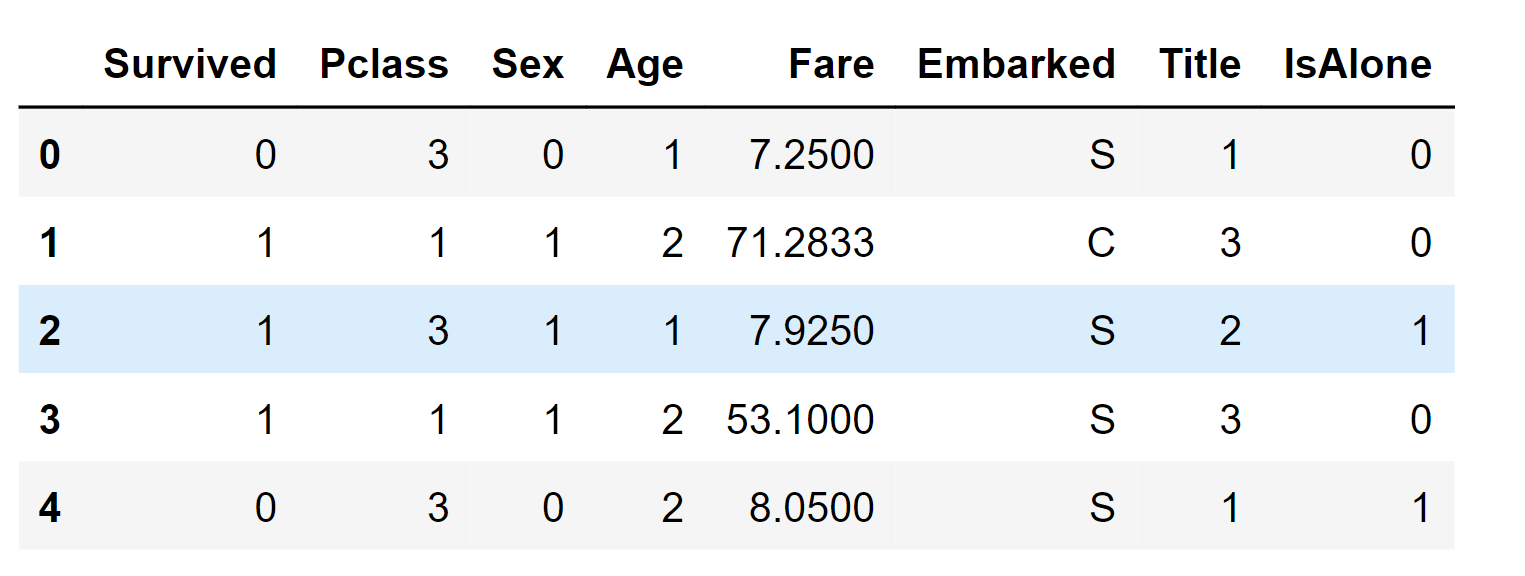
We can also generate a synthetic attribute by combining Pclass and Age. Output: 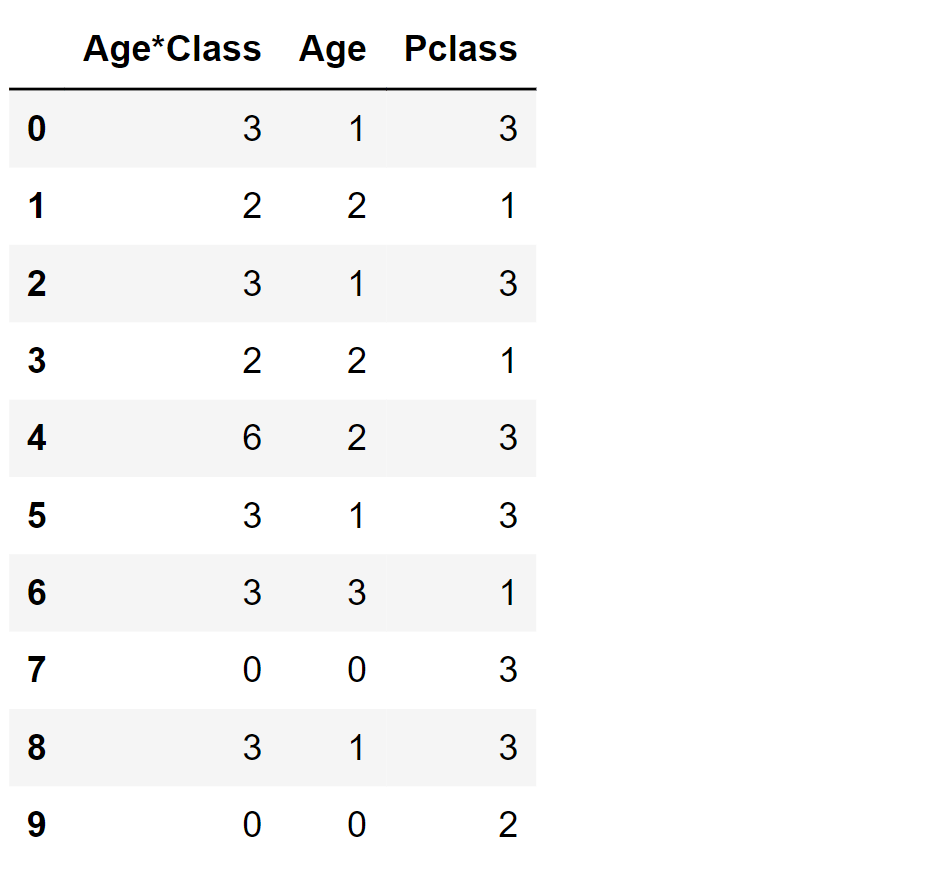
Categorical FeatureThe Embarked feature is represented by S, Q, and C values, denoting the port of embarkation. Our dataset contains two instances with missing values in this feature. We can conveniently replace these gaps with the most frequent occurrence. Output: 
Output: 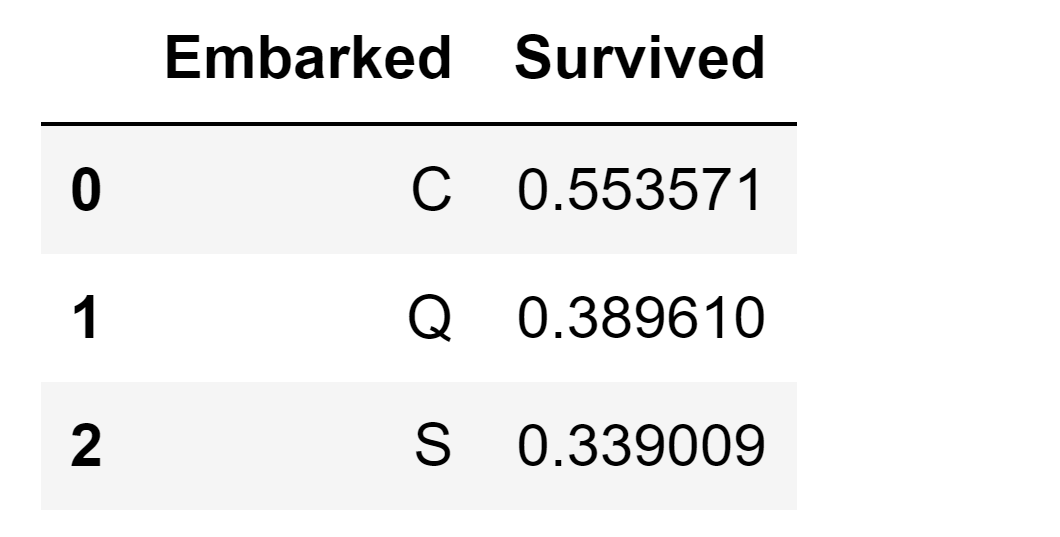
Categorical to NumericalWe can proceed by transforming the EmbarkedFill feature into a fresh numeric feature called port. Output: 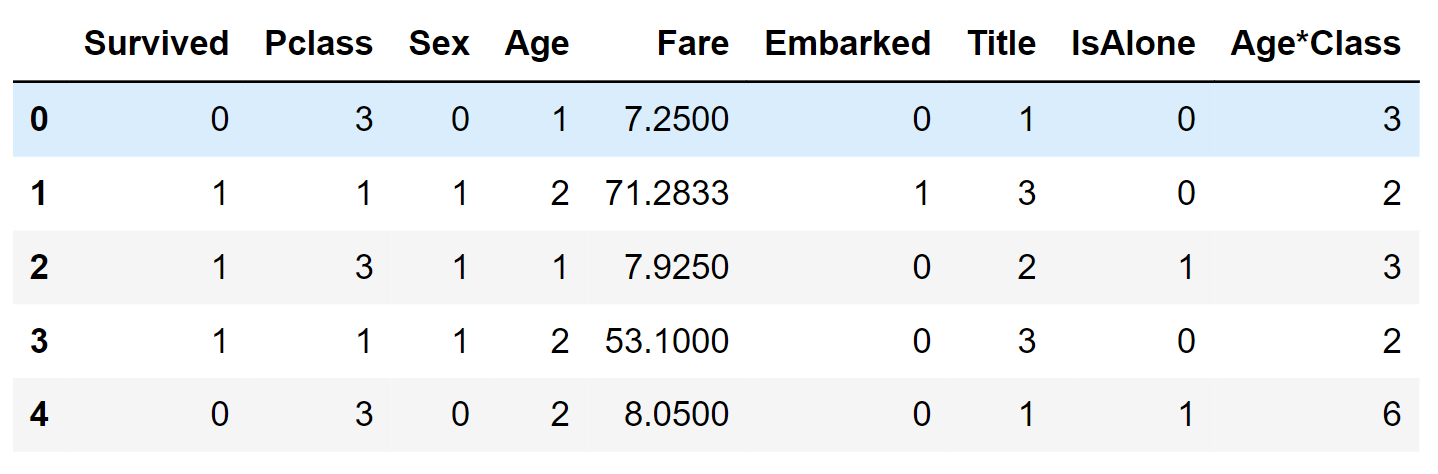
We can not create FareBand. Output: 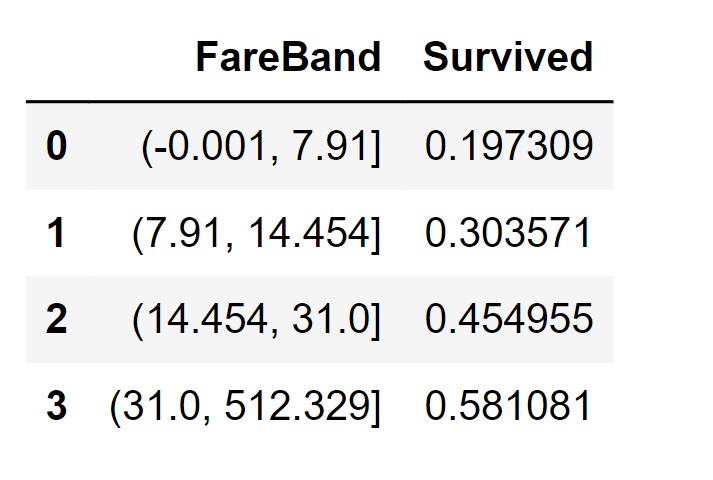
Transform the Fare feature into ordinal values using the FareBand categories. Output: 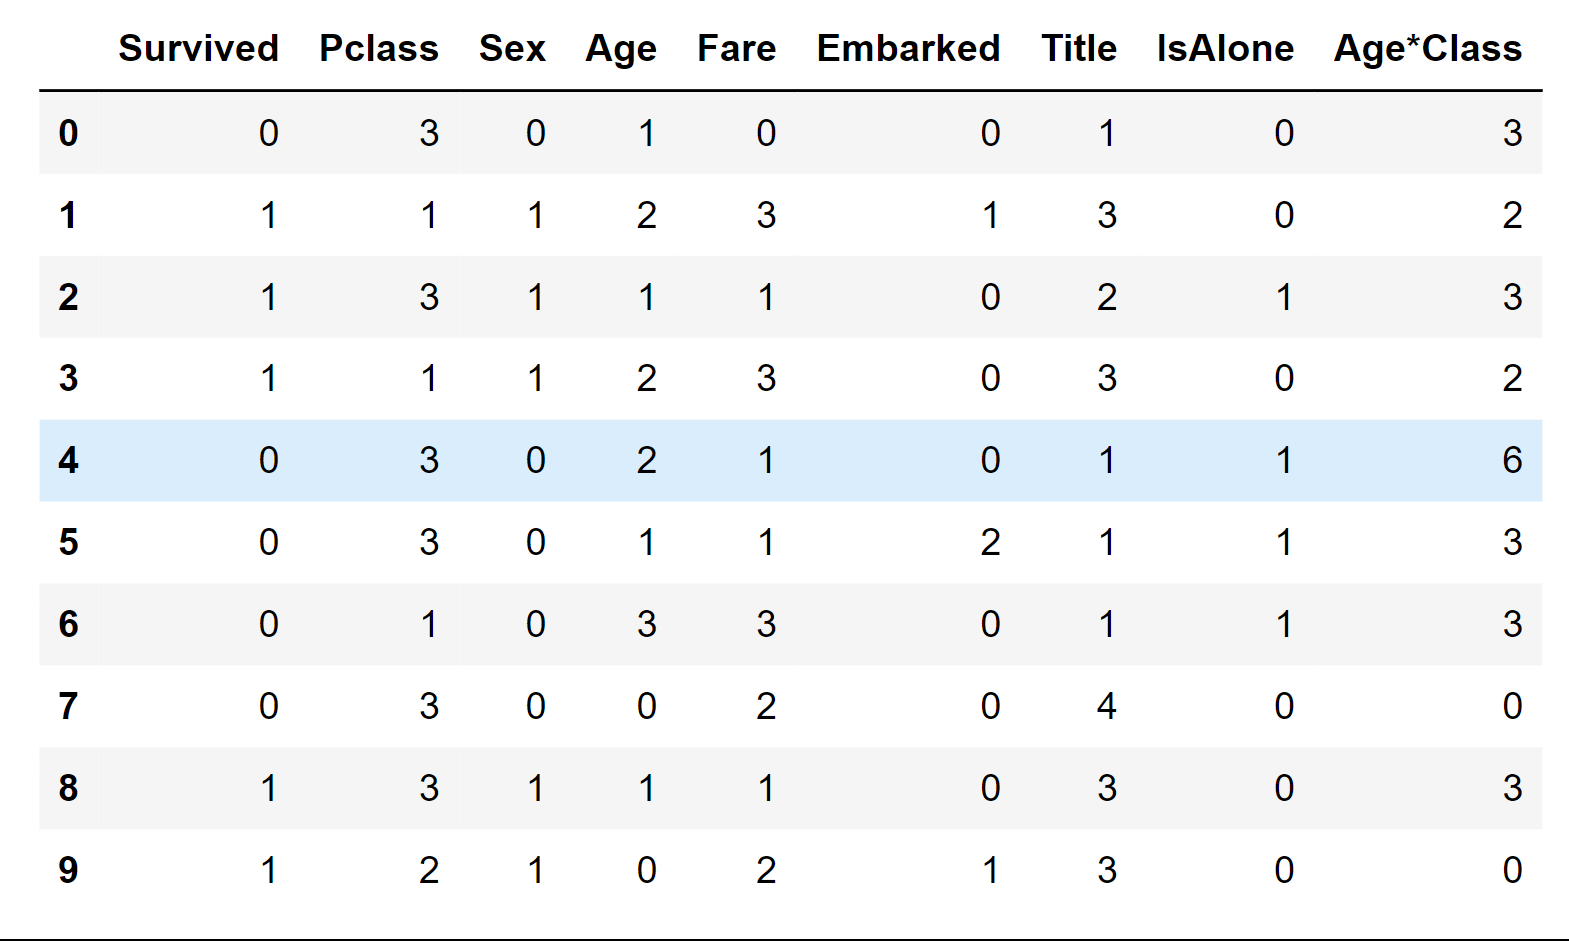
ModelingNow we are set to proceed with training a model and making predictions for our desired solution. We have a range of over 60 predictive modeling algorithms at our disposal. However, to streamline our selection process, it's important to consider the nature of the problem and the specific solution requirements. In our case, we are dealing with a classification and regression problem. Our goal is to establish relationships between the output (whether a passenger survived or not) and various other variables or features (such as Gender, Age, and Port of embarkation). This falls within the category of supervised learning, as we are using a provided dataset to train our model. Based on these criteria - supervised learning combined with classification and regression - we can narrow down our options to a few suitable models. These include
RVM (Relevance Vector Machine) Output: 
Logistic RegressionLogistic Regression proves valuable to implement early in the analysis. It assesses the connection between a categorical dependent variable (feature) and one or more independent variables (features) by estimating probabilities through a logistic function, representing the cumulative logistic distribution. Output: 
We can employ Logistic Regression to validate our assumptions and decisions regarding feature creation and completion objectives. This can be achieved by calculating the coefficients of the features in the decision function. Positive coefficients amplify the log-odds of the response (and subsequently boost the probability), whereas negative coefficients diminish the log-odds of the response (and thereby lower the probability).
Output: 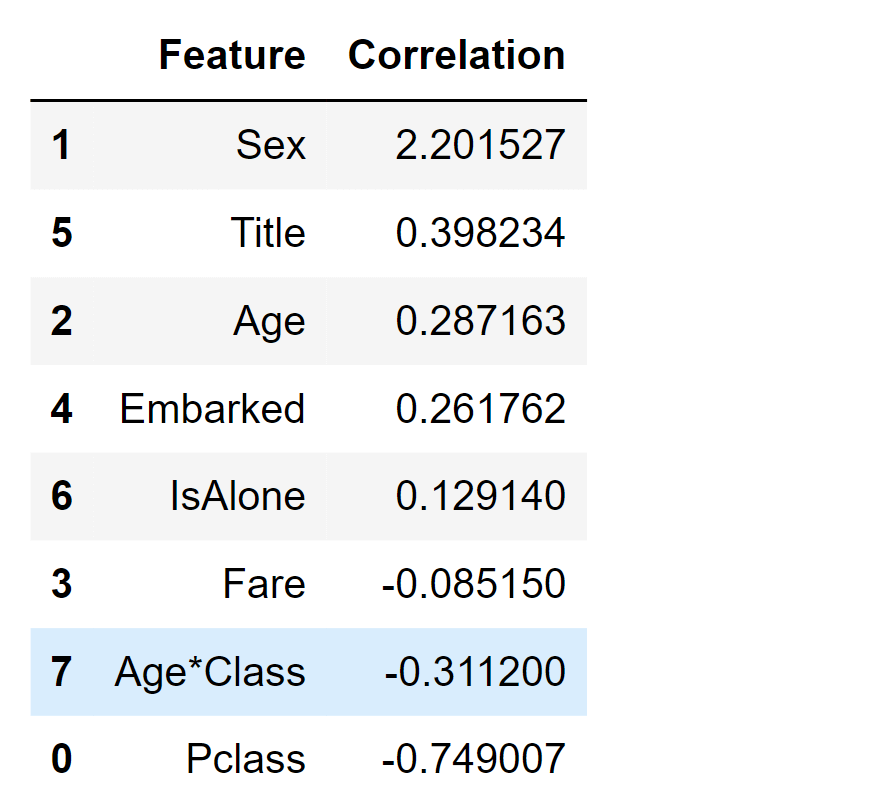
SVMSupport Vector Machines (SVMs) are models in supervised learning equipped with corresponding learning algorithms that examine data for classification and regression analysis. When provided with a collection of training samples, each labeled as part of either of two classes, an SVM training algorithm constructs a model that assigns new test samples to one of these two categories. This characteristic classifies SVM as a non-probabilistic binary linear classifier. Output: 
K-Nearest NeighbourIn the field of pattern recognition, the k-Nearest Neighbors algorithm (abbreviated as k-NN) is an approach devoid of specific parameters, often employed for tasks of classification and regression. This method entails determining the category of a sample based on the collective opinion of its nearby instances. The sample is allocated to the class that is most prevalent among its k closest neighbors (where k is a positive integer, often small). When k equals 1, the item is directly assigned to the class of the closest neighbor. Output: 
Naive BayesNaive Bayes classifiers belong to a category of straightforward probabilistic classifiers that utilize Bayes' theorem while assuming strong (naive) independence among the features. These classifiers are known for their excellent scalability, as they necessitate a number of parameters that grow linearly with the count of variables (features) in a given learning scenario. Output: 
PerceptronThis model uses a decision tree as a predictive model which maps features (tree branches) to conclusions about the target value (tree leaves). Tree models where the target variable can take a finite set of values are called classification trees; in these tree structures, leaves represent class labels, and branches represent conjunctions of features that lead to those class labels. Decision trees where the target variable can take continuous values (typically real numbers) are called regression trees. Output: 
Linear SVCOutput: 
Stochastic Gradient DescentOutput: 
Decision TreeThis model employs a decision tree as a predictive tool that establishes a connection between features (depicted as branches of the tree) and conclusions regarding the target value (represented by tree leaves). When the target variable has a finite range of values, the tree structures are referred to as classification trees. In these structures, class labels are found on the leaves, while branches represent combinations of features that correspond to those class labels. On the other hand, if the target variable can have continuous values, usually real numbers, the resulting decision trees are known as regression trees. Output: 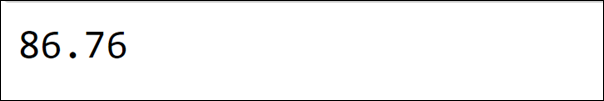
Random ForestRandom Forests stand as one of the widely embraced techniques. They are an ensemble learning approach used for tasks like classification and regression. This method involves creating numerous decision trees (n_estimators=100) during training and then determining the mode of classes (for classification) or the average prediction (for regression) from the outcomes of individual trees. Output:
The model confidence score is the highest among the models evaluated so far. Model EvaluationWe can now assess and compare the performance of all our models to determine the optimal one for our task. Although Decision Tree and Random Forest yield identical scores, we opt for Random Forest due to its capability to mitigate the tendency of decision trees to excessively adapt to their training data, a phenomenon known as overfitting. Output: 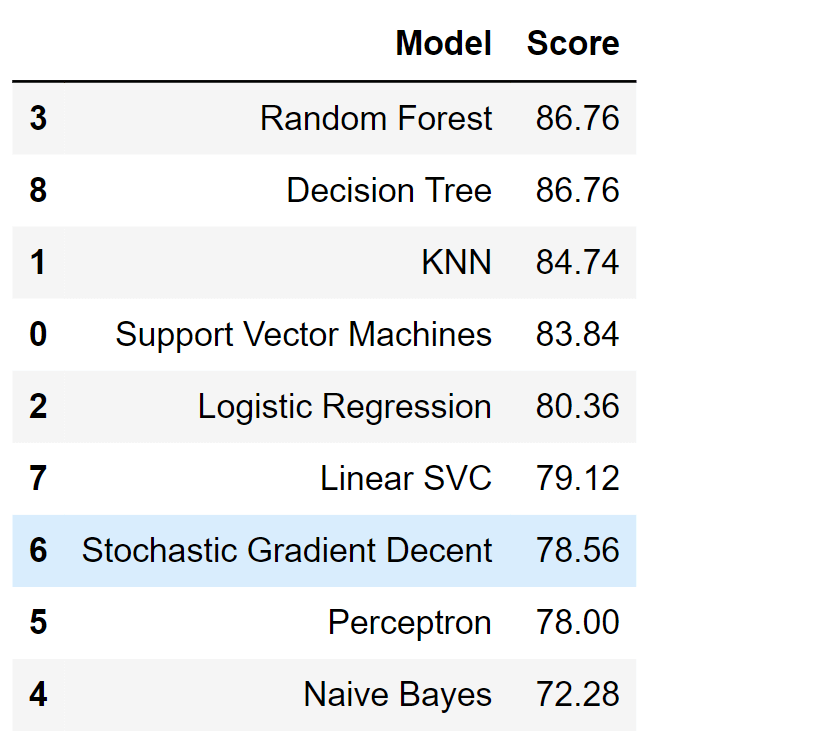
We will opt Random Forest over Decision Tree, due to its overcoming nature for overfitting. ConclusionThe Titanic dataset has evolved from being a historical record of a tragic event to a valuable tool for learning and practicing machine-learning techniques. It provides a hands-on opportunity to explore data preprocessing, feature engineering, exploratory data analysis, model building, and evaluation. Aspiring data scientists and machine learning enthusiasts can gain a deeper understanding of the intricacies and challenges involved in real-world data analysis through the Titanic- Machine Learning From Disaster competition. |
 For Videos Join Our Youtube Channel: Join Now
Feedback
- Send your Feedback to [email protected]
Help Others, Please Share


