| |

Performance Metrics in Machine LearningEvaluating the performance of a Machine learning model is one of the important steps while building an effective ML model. To evaluate the performance or quality of the model, different metrics are used, and these metrics are known as performance metrics or evaluation metrics. These performance metrics help us understand how well our model has performed for the given data. In this way, we can improve the model's performance by tuning the hyper-parameters. Each ML model aims to generalize well on unseen/new data, and performance metrics help determine how well the model generalizes on the new dataset. 
In machine learning, each task or problem is divided into classification and Regression. Not all metrics can be used for all types of problems; hence, it is important to know and understand which metrics should be used. Different evaluation metrics are used for both Regression and Classification tasks. In this topic, we will discuss metrics used for classification and regression tasks. 1. Performance Metrics for ClassificationIn a classification problem, the category or classes of data is identified based on training data. The model learns from the given dataset and then classifies the new data into classes or groups based on the training. It predicts class labels as the output, such as Yes or No, 0 or 1, Spam or Not Spam, etc. To evaluate the performance of a classification model, different metrics are used, and some of them are as follows:
I. AccuracyThe accuracy metric is one of the simplest Classification metrics to implement, and it can be determined as the number of correct predictions to the total number of predictions. It can be formulated as: 
To implement an accuracy metric, we can compare ground truth and predicted values in a loop, or we can also use the scikit-learn module for this. Firstly, we need to import the accuracy_score function of the scikit-learn library as follows: Although it is simple to use and implement, it is suitable only for cases where an equal number of samples belong to each class. When to Use Accuracy? It is good to use the Accuracy metric when the target variable classes in data are approximately balanced. For example, if 60% of classes in a fruit image dataset are of Apple, 40% are Mango. In this case, if the model is asked to predict whether the image is of Apple or Mango, it will give a prediction with 97% of accuracy. When not to use Accuracy? It is recommended not to use the Accuracy measure when the target variable majorly belongs to one class. For example, Suppose there is a model for a disease prediction in which, out of 100 people, only five people have a disease, and 95 people don't have one. In this case, if our model predicts every person with no disease (which means a bad prediction), the Accuracy measure will be 95%, which is not correct. II. Confusion MatrixA confusion matrix is a tabular representation of prediction outcomes of any binary classifier, which is used to describe the performance of the classification model on a set of test data when true values are known. The confusion matrix is simple to implement, but the terminologies used in this matrix might be confusing for beginners. A typical confusion matrix for a binary classifier looks like the below image(However, it can be extended to use for classifiers with more than two classes). 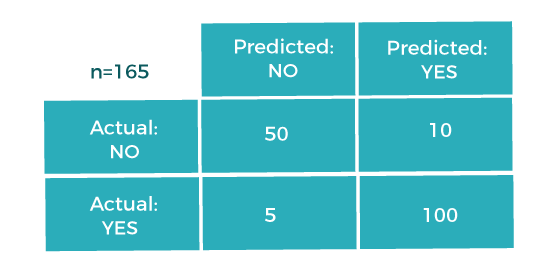
We can determine the following from the above matrix:
In general, the table is divided into four terminologies, which are as follows:
III. PrecisionThe precision metric is used to overcome the limitation of Accuracy. The precision determines the proportion of positive prediction that was actually correct. It can be calculated as the True Positive or predictions that are actually true to the total positive predictions (True Positive and False Positive). 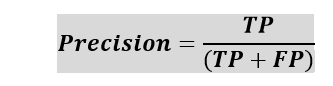
IV. Recall or SensitivityIt is also similar to the Precision metric; however, it aims to calculate the proportion of actual positive that was identified incorrectly. It can be calculated as True Positive or predictions that are actually true to the total number of positives, either correctly predicted as positive or incorrectly predicted as negative (true Positive and false negative). The formula for calculating Recall is given below: 
When to use Precision and Recall? From the above definitions of Precision and Recall, we can say that recall determines the performance of a classifier with respect to a false negative, whereas precision gives information about the performance of a classifier with respect to a false positive. So, if we want to minimize the false negative, then, Recall should be as near to 100%, and if we want to minimize the false positive, then precision should be close to 100% as possible. In simple words, if we maximize precision, it will minimize the FP errors, and if we maximize recall, it will minimize the FN error. V. F-ScoresF-score or F1 Score is a metric to evaluate a binary classification model on the basis of predictions that are made for the positive class. It is calculated with the help of Precision and Recall. It is a type of single score that represents both Precision and Recall. So, the F1 Score can be calculated as the harmonic mean of both precision and Recall, assigning equal weight to each of them. The formula for calculating the F1 score is given below: 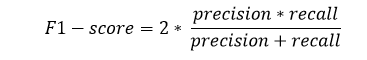
When to use F-Score? As F-score make use of both precision and recall, so it should be used if both of them are important for evaluation, but one (precision or recall) is slightly more important to consider than the other. For example, when False negatives are comparatively more important than false positives, or vice versa. VI. AUC-ROCSometimes we need to visualize the performance of the classification model on charts; then, we can use the AUC-ROC curve. It is one of the popular and important metrics for evaluating the performance of the classification model. Firstly, let's understand ROC (Receiver Operating Characteristic curve) curve. ROC represents a graph to show the performance of a classification model at different threshold levels. The curve is plotted between two parameters, which are:
TPR or true Positive rate is a synonym for Recall, hence can be calculated as: 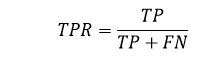
FPR or False Positive Rate can be calculated as: 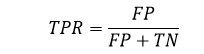
To calculate value at any point in a ROC curve, we can evaluate a logistic regression model multiple times with different classification thresholds, but this would not be much efficient. So, for this, one efficient method is used, which is known as AUC. AUC: Area Under the ROC curveAUC is known for Area Under the ROC curve. As its name suggests, AUC calculates the two-dimensional area under the entire ROC curve, as shown below image: 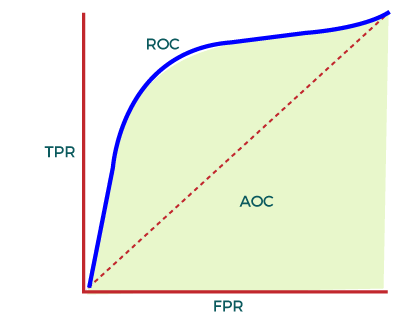
AUC calculates the performance across all the thresholds and provides an aggregate measure. The value of AUC ranges from 0 to 1. It means a model with 100% wrong prediction will have an AUC of 0.0, whereas models with 100% correct predictions will have an AUC of 1.0. When to Use AUC AUC should be used to measure how well the predictions are ranked rather than their absolute values. Moreover, it measures the quality of predictions of the model without considering the classification threshold. When not to use AUC As AUC is scale-invariant, which is not always desirable, and we need calibrating probability outputs, then AUC is not preferable. Further, AUC is not a useful metric when there are wide disparities in the cost of false negatives vs. false positives, and it is difficult to minimize one type of classification error. 2. Performance Metrics for RegressionRegression is a supervised learning technique that aims to find the relationships between the dependent and independent variables. A predictive regression model predicts a numeric or discrete value. The metrics used for regression are different from the classification metrics. It means we cannot use the Accuracy metric (explained above) to evaluate a regression model; instead, the performance of a Regression model is reported as errors in the prediction. Following are the popular metrics that are used to evaluate the performance of Regression models.
I. Mean Absolute Error (MAE)Mean Absolute Error or MAE is one of the simplest metrics, which measures the absolute difference between actual and predicted values, where absolute means taking a number as Positive. To understand MAE, let's take an example of Linear Regression, where the model draws a best fit line between dependent and independent variables. To measure the MAE or error in prediction, we need to calculate the difference between actual values and predicted values. But in order to find the absolute error for the complete dataset, we need to find the mean absolute of the complete dataset. The below formula is used to calculate MAE: 
Here, Y is the Actual outcome, Y' is the predicted outcome, and N is the total number of data points. MAE is much more robust for the outliers. One of the limitations of MAE is that it is not differentiable, so for this, we need to apply different optimizers such as Gradient Descent. However, to overcome this limitation, another metric can be used, which is Mean Squared Error or MSE. II. Mean Squared ErrorMean Squared error or MSE is one of the most suitable metrics for Regression evaluation. It measures the average of the Squared difference between predicted values and the actual value given by the model. Since in MSE, errors are squared, therefore it only assumes non-negative values, and it is usually positive and non-zero. Moreover, due to squared differences, it penalizes small errors also, and hence it leads to over-estimation of how bad the model is. MSE is a much-preferred metric compared to other regression metrics as it is differentiable and hence optimized better. The formula for calculating MSE is given below: 
Here, Y is the Actual outcome, Y' is the predicted outcome, and N is the total number of data points. III. R Squared ScoreR squared error is also known as Coefficient of Determination, which is another popular metric used for Regression model evaluation. The R-squared metric enables us to compare our model with a constant baseline to determine the performance of the model. To select the constant baseline, we need to take the mean of the data and draw the line at the mean. The R squared score will always be less than or equal to 1 without concerning if the values are too large or small. 
IV. Adjusted R SquaredAdjusted R squared, as the name suggests, is the improved version of R squared error. R square has a limitation of improvement of a score on increasing the terms, even though the model is not improving, and it may mislead the data scientists. To overcome the issue of R square, adjusted R squared is used, which will always show a lower value than R². It is because it adjusts the values of increasing predictors and only shows improvement if there is a real improvement. We can calculate the adjusted R squared as follows: 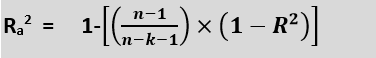
Here, n is the number of observations k denotes the number of independent variables and Ra2 denotes the adjusted R2
Next TopicOptimization using Hopfield Network
|
 For Videos Join Our Youtube Channel: Join Now
Feedback
- Send your Feedback to [email protected]
Help Others, Please Share


