| |

Heart Disease Prediction Using Machine Learning
Cardiovascular diseases represent a significant worldwide health issue, causing a substantial number of deaths. Prompt identification and preventive measures are vital for mitigating their effects. Recently, a class of innovative computational methods known as machine learning has proven highly effective in prognosticating and diagnosing diverse medical ailments, and heart disease is one of them. By harnessing extensive datasets and cutting-edge algorithms, these models can accurately pinpoint individuals susceptible to heart disease and facilitate timely interventions. This article explores the domain of heart disease prediction through machine learning, shedding light on its promise, hurdles, and implications within the healthcare sector. Various ailments, including coronary artery disease, heart failure, and irregular heart rhythms, fall under the umbrella term "heart disease." Detecting individuals at an early stage who are susceptible to these conditions can substantially enhance the well-being of patients through prompt interventions and adjustments to their way of life. Now we try to predict whether a patient has heart disease or not under a given clinical parameter. Data is abstracted from https://archive.ics.uci.edu/ml/datasets/heart+Disease FeaturesBelow are the details and descriptions of the data features.
Code: Importing LibrariesLoading DatasetOutput: 
EDA(Exploratory Data Analysis)EDA plays a vital role in comprehending the dataset and extracting valuable insights. EDA encompasses a range of techniques aimed at thoroughly examining and visually representing the data, with the objective of unveiling underlying patterns, relationships, and possible anomalies that may exist within the dataset. Output: 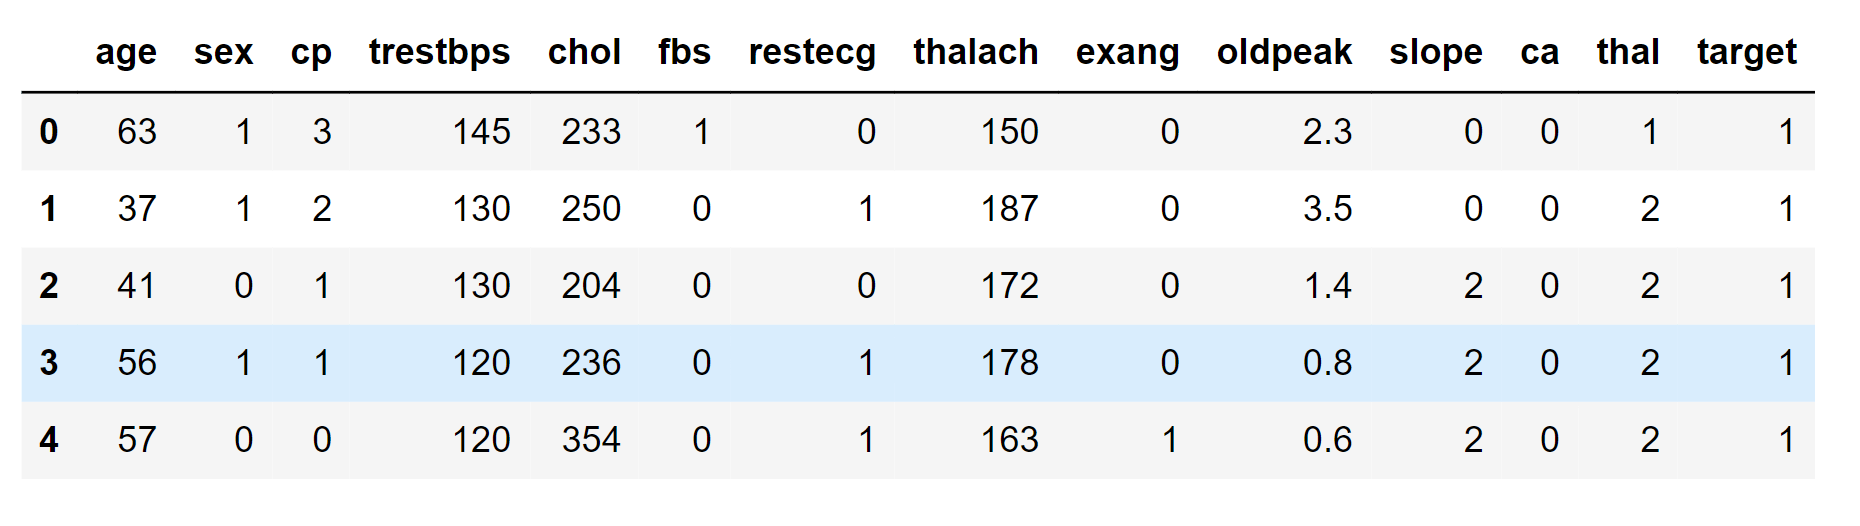
Output: 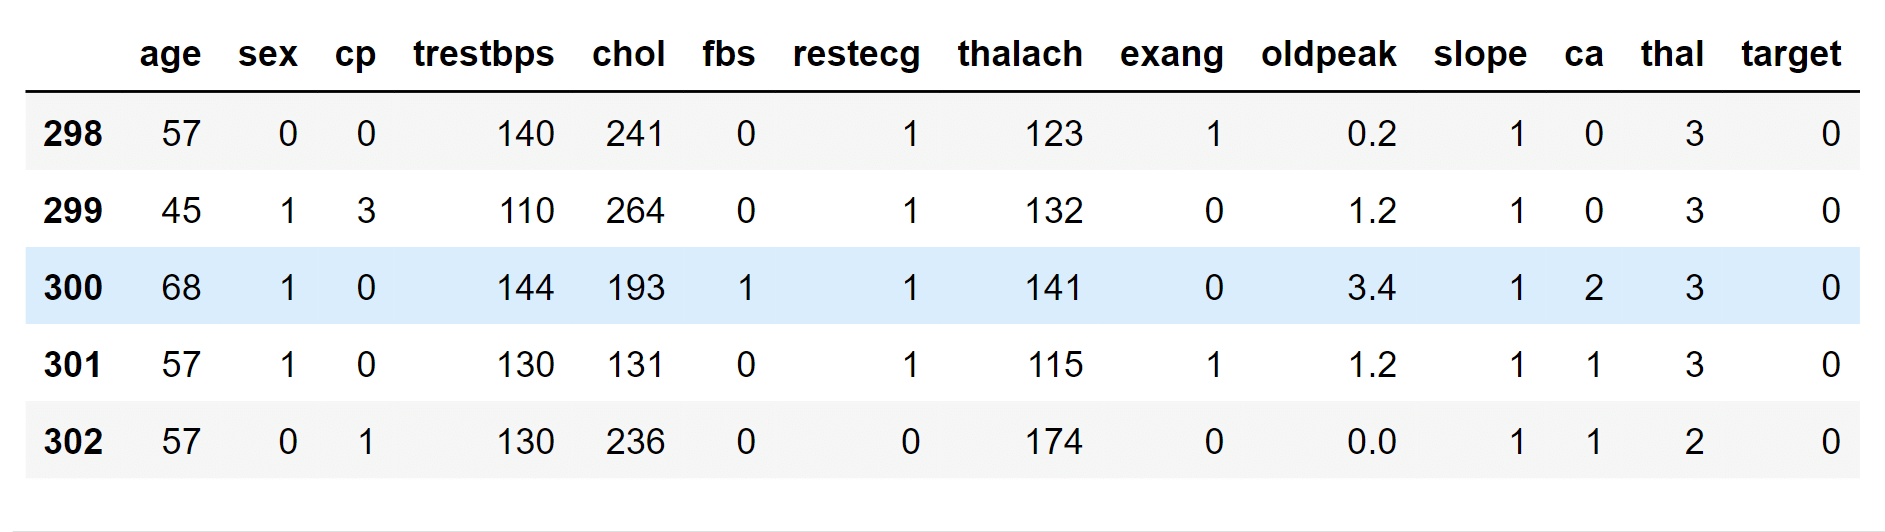
Output: 
Output: 
In this bar chart, we can see that more data samples show heart disease. Output: 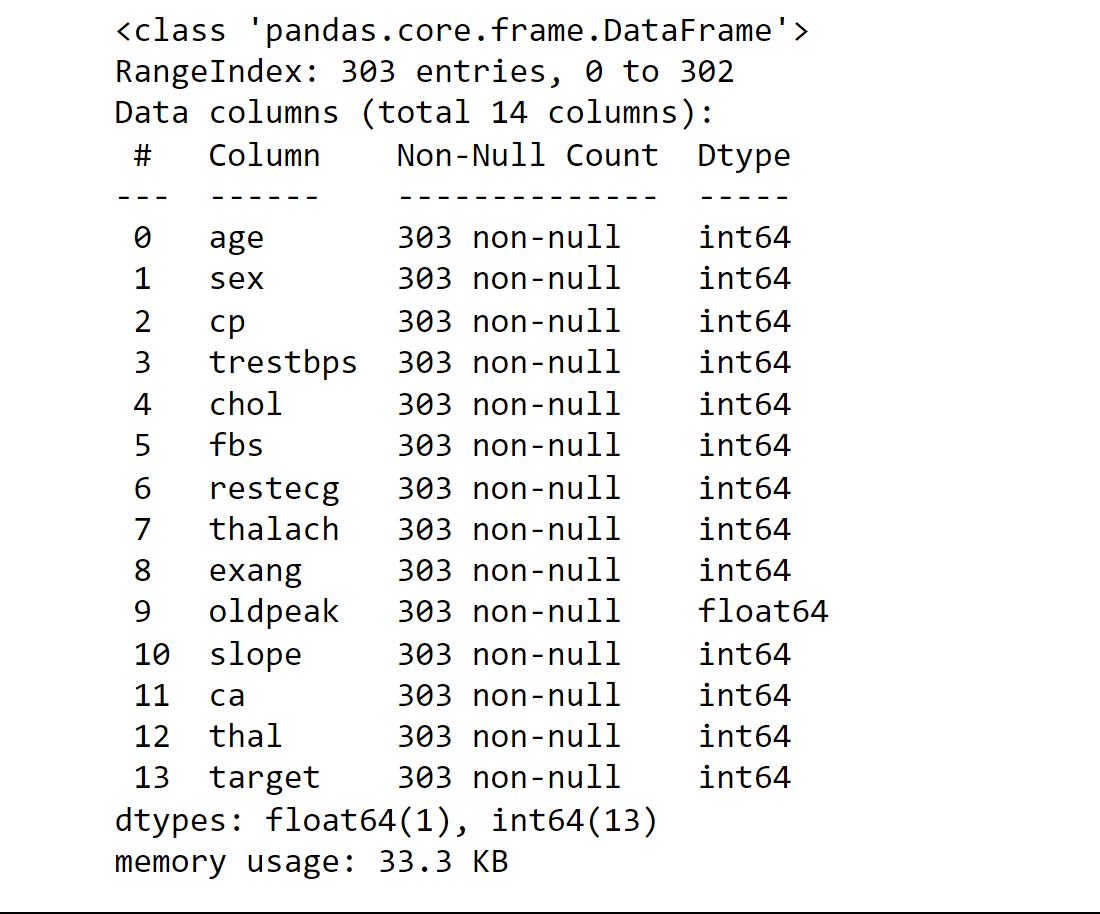
Output: 
Output: 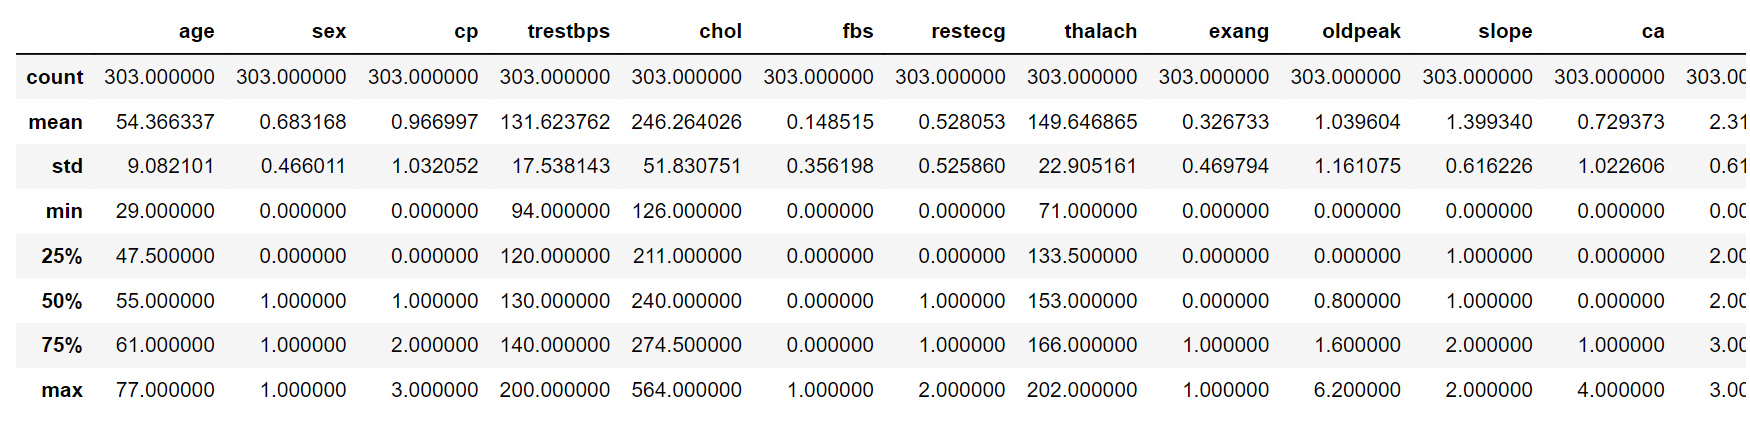
Heart Disease Frequency according to sexOutput: 
Output: 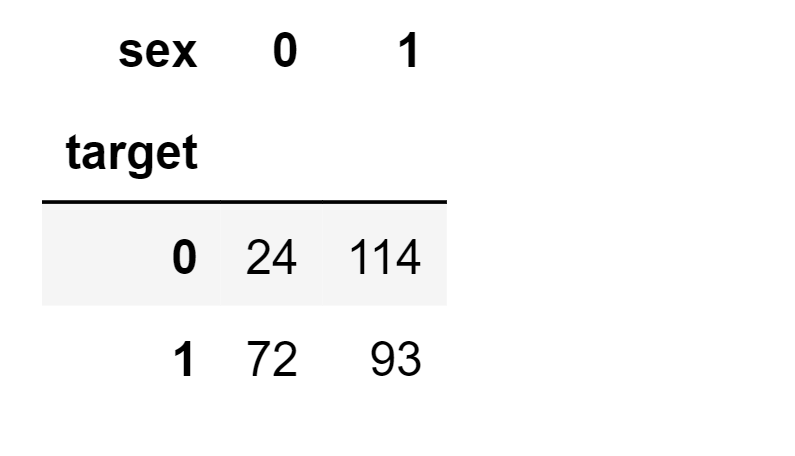
Output: 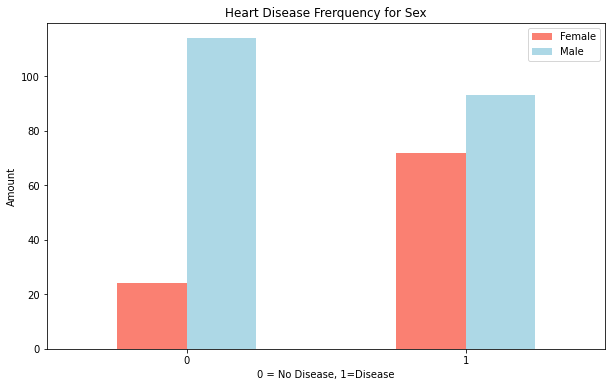
From the bar chart above, the frequency of females getting heart disease is higher in this dataset compared to males. Age vs. Max Heart Rate for Heart DiseaseOutput: 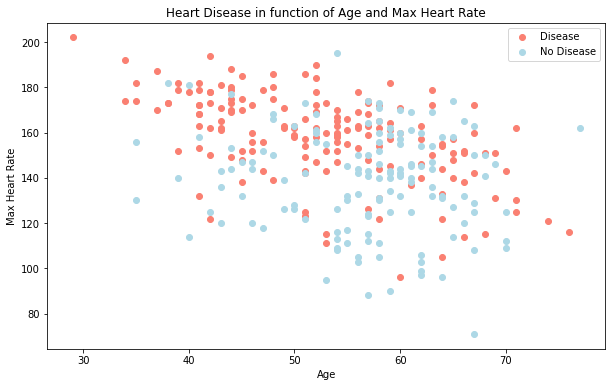
The chances of getting a maximum heart rate are higher for heart disease patients. Output: 
In this histogram, we can see that approximately half of the sample's age is between 55 to 65 years old. The rest are from the 40s to 70s. There are also a few samples for 30-40 and 70 above. Heart Disease Frequency per Chest Pain Typecp - chest pain type
Output: 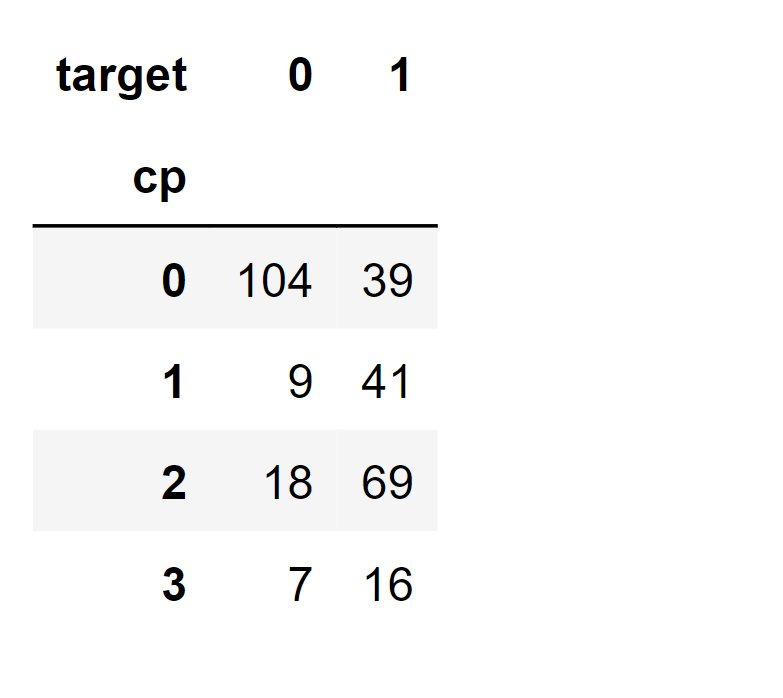
Output: 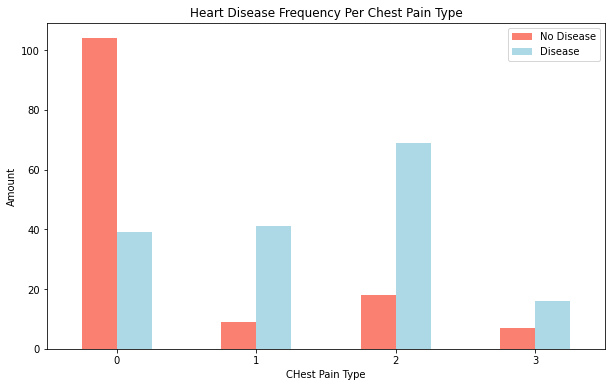
Most heart disease patients suffer from the third chest pain type, which is non-anginal pain, and some of those suffering from the first chest pain type, typical angina, and atypical angina. Although the second and third chest pain type is non-related to the heart, the data shows patients will suffer from those chest pain types. To make a conclusion, we might need to approach some healthcare professionals to ask for their opinions. CorrelationOutput: 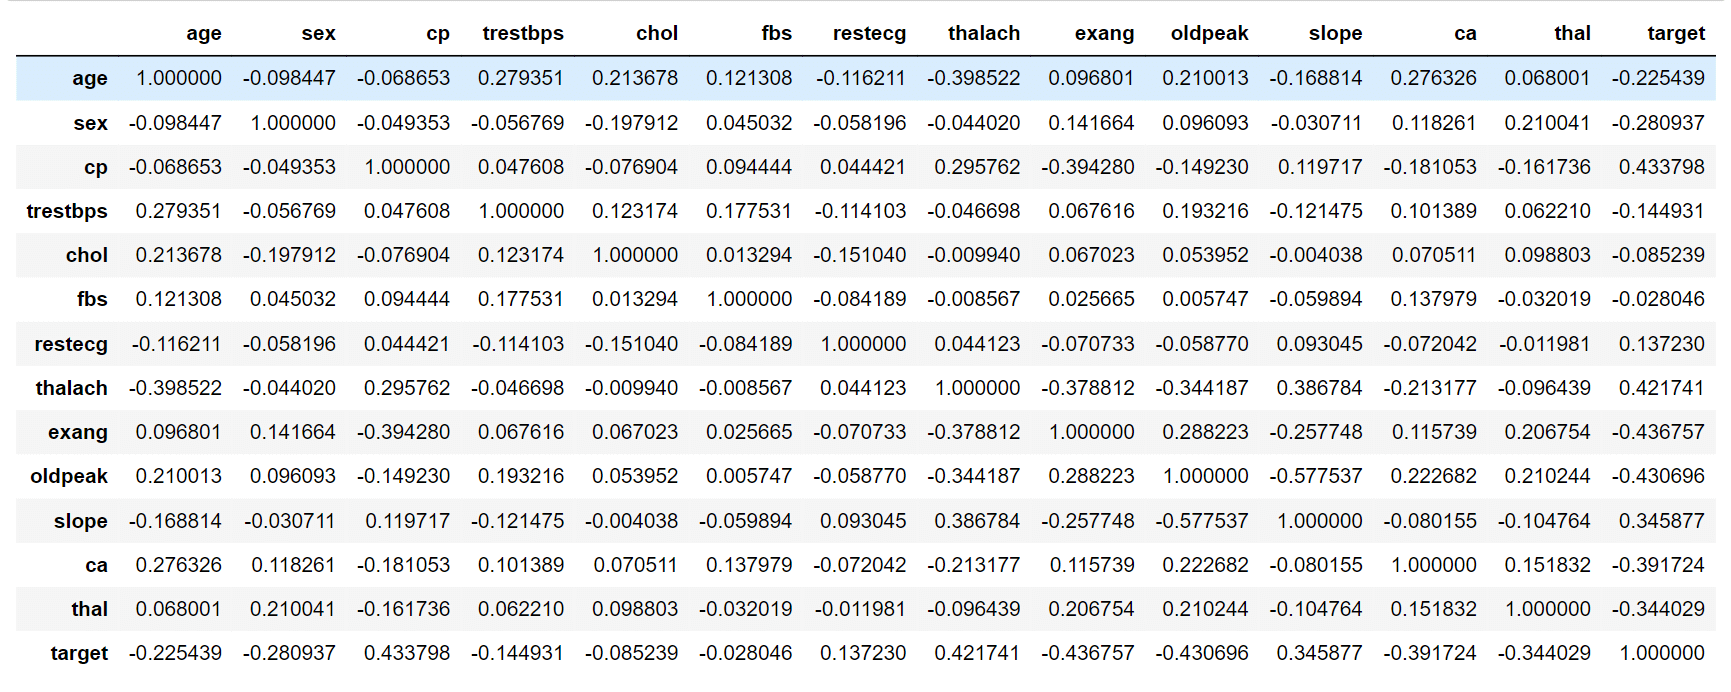
Output: 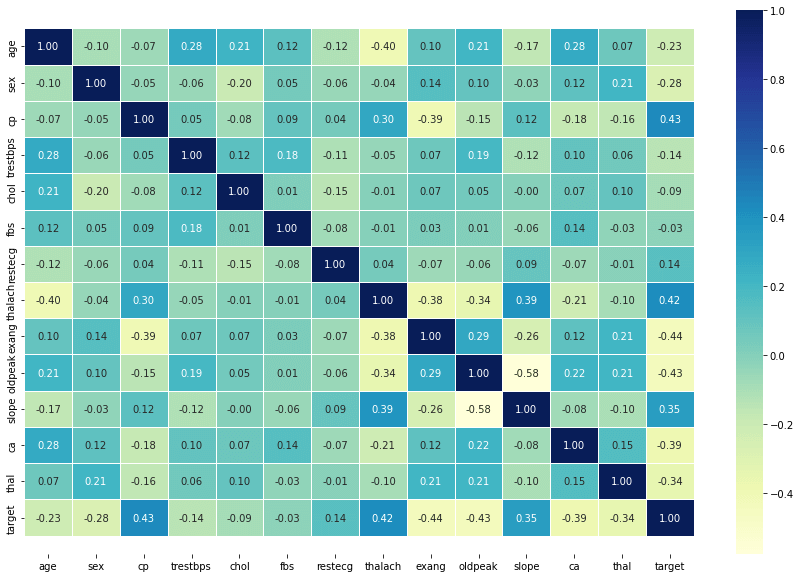
1. Positive correlation, both variables increase or decrease in the same direction 2. Negative correlation, one variable increase and one variable decrease vice versa Result 1: Chest pain and target have a positive correlation -> Higher chest pain level, and more targets may get heart disease. ModelingTrain Base ModelsHere we will employ the following machine-learning models:
Output: 
Base Model ComparisonOutput: 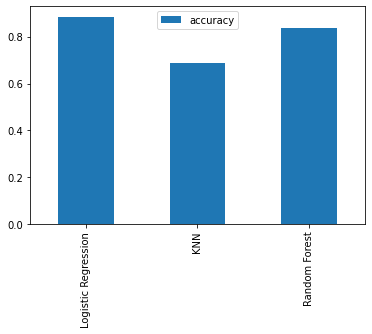
For the base model, Logistic Regression and Random Forest work way better than KNN. Hyperparameter TuningWe will employ the following ways of Hyperparameter Tuning:
Tune By HandOutput: 
Output: Maximum KNN score on the test data: 75.41% 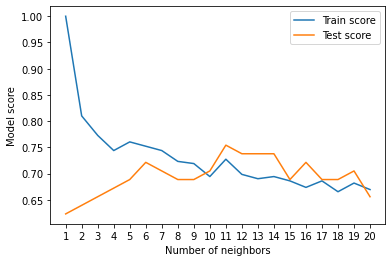
After tuning the parameter for k value, the KNN classifier has improved, but the performance is still lower than Logistic Regression and Random Forest. Hyperparameter tuning with RandomizedSearchCVOutput: 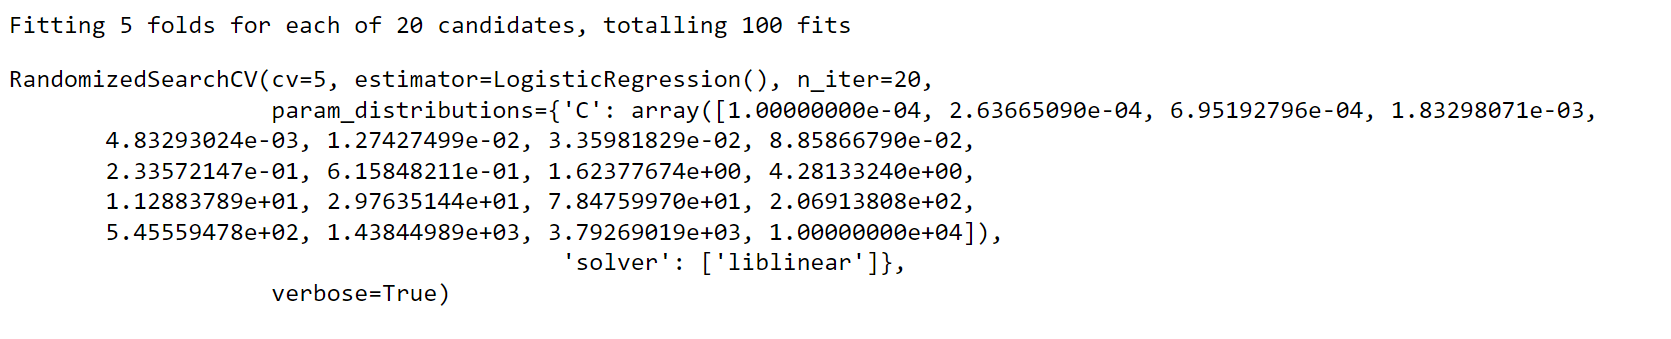
Output: 
Output: 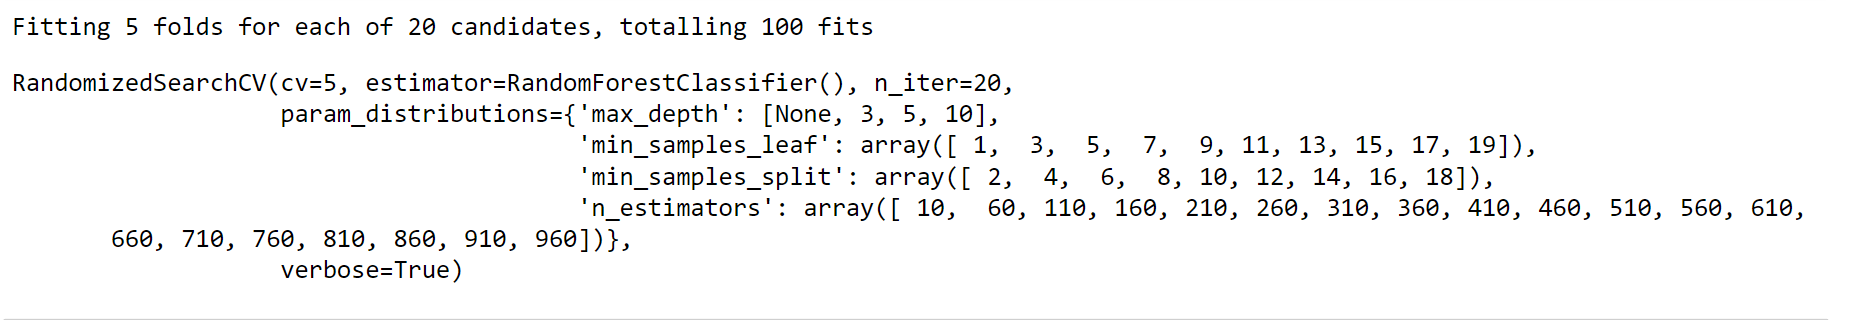
Output: 
Output: 
By using RandomizedSearchCV, the performance of random forest models has improved. But the logistic regression model's performance is still higher. Hyperparameter Tuning with GridSearchCVOutput: 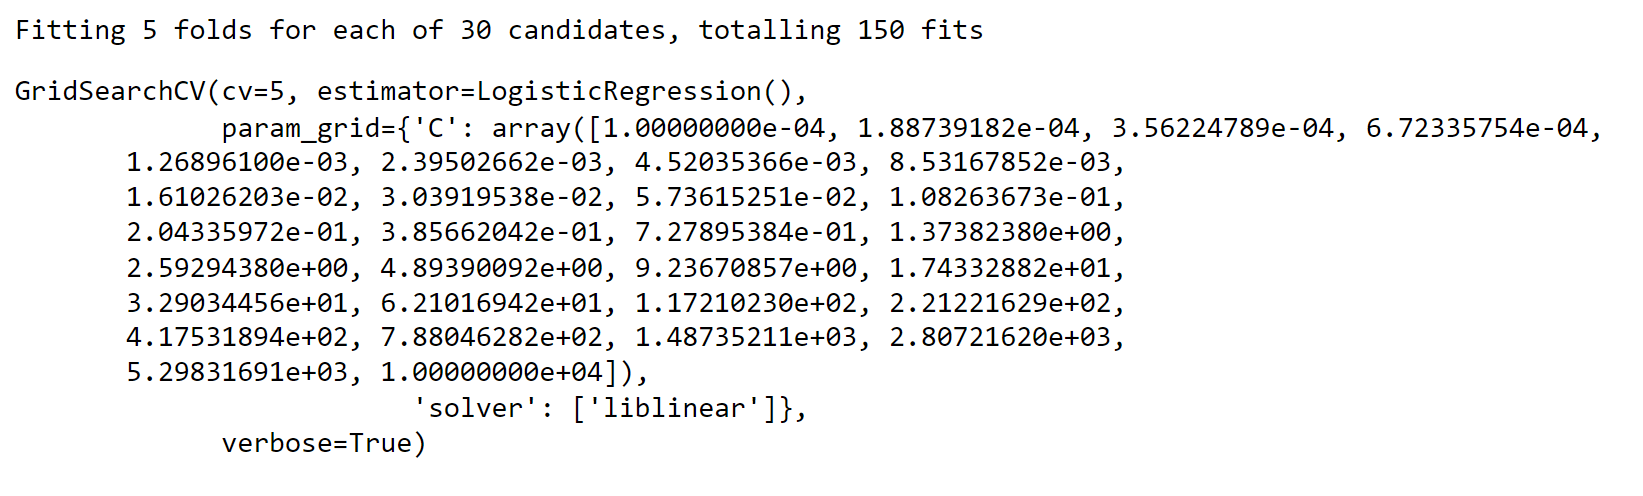
Output: 
Output: 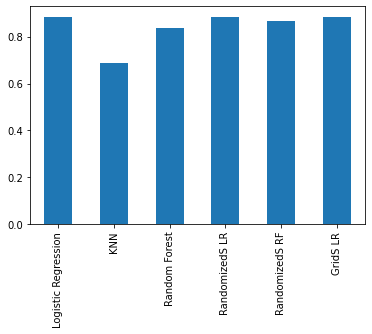
Logistic Regression has the same scores for all of the different hyperparameter tuning models. Out of three different classifiers, Logistic Regression has the best performance score during the training stage. Evaluating tuned machine learning classifier beyond accuracyWe will be using the following metrics for evaluation:
Output: 
Output: 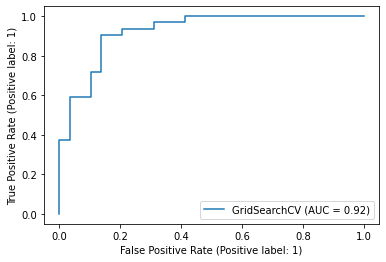
Output: 
Output: 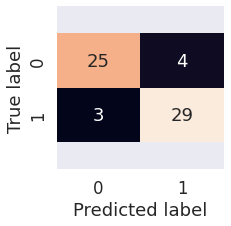
Classification Report Output: 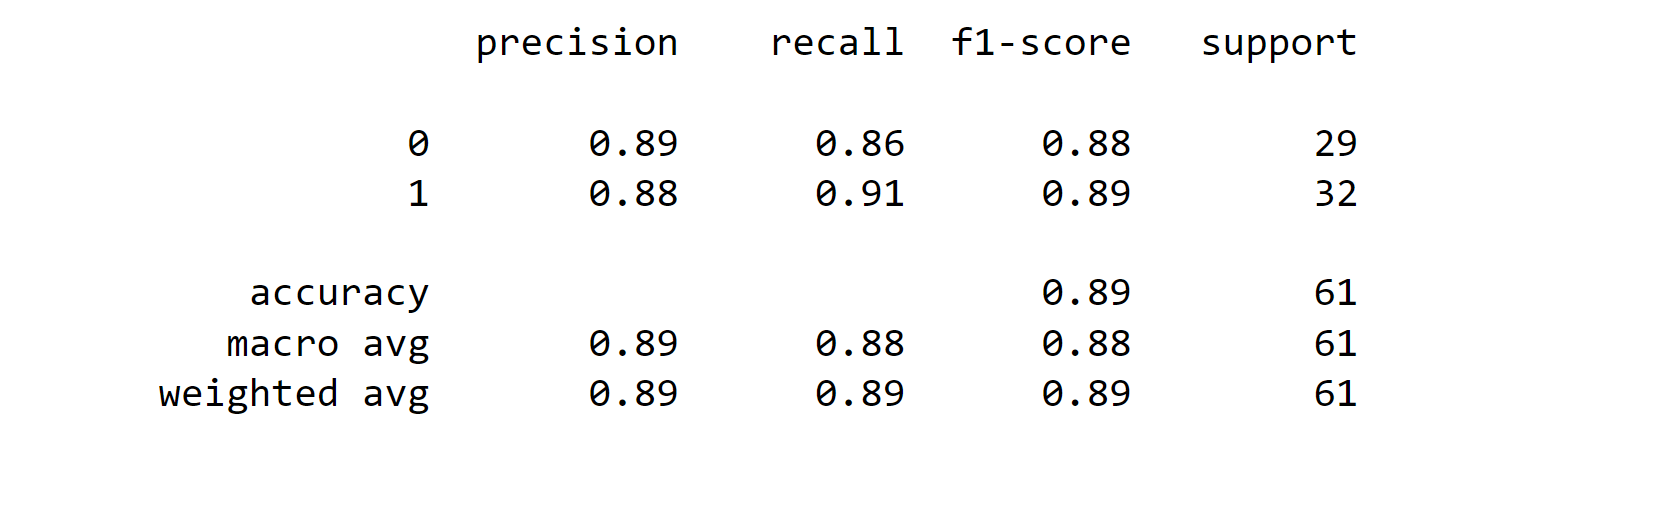
Calculate evaluation metrics using cross-validation using cross_val_score() Output: 
Output: 
Output: 
Output: 
Output: 
Output: 
Output: 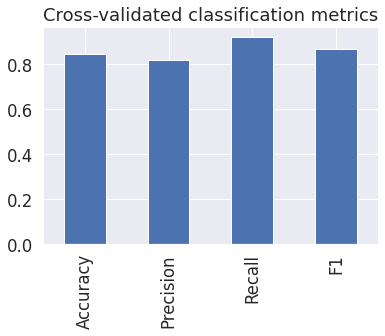
Feature ImportanceFeature importance is another as asking, "which features contributed most to the outcome of the model and how did they contribute?" Finding feature importance is different for each machine learning model. We may refer to feature importance for future collecting data. Output: 
Output: 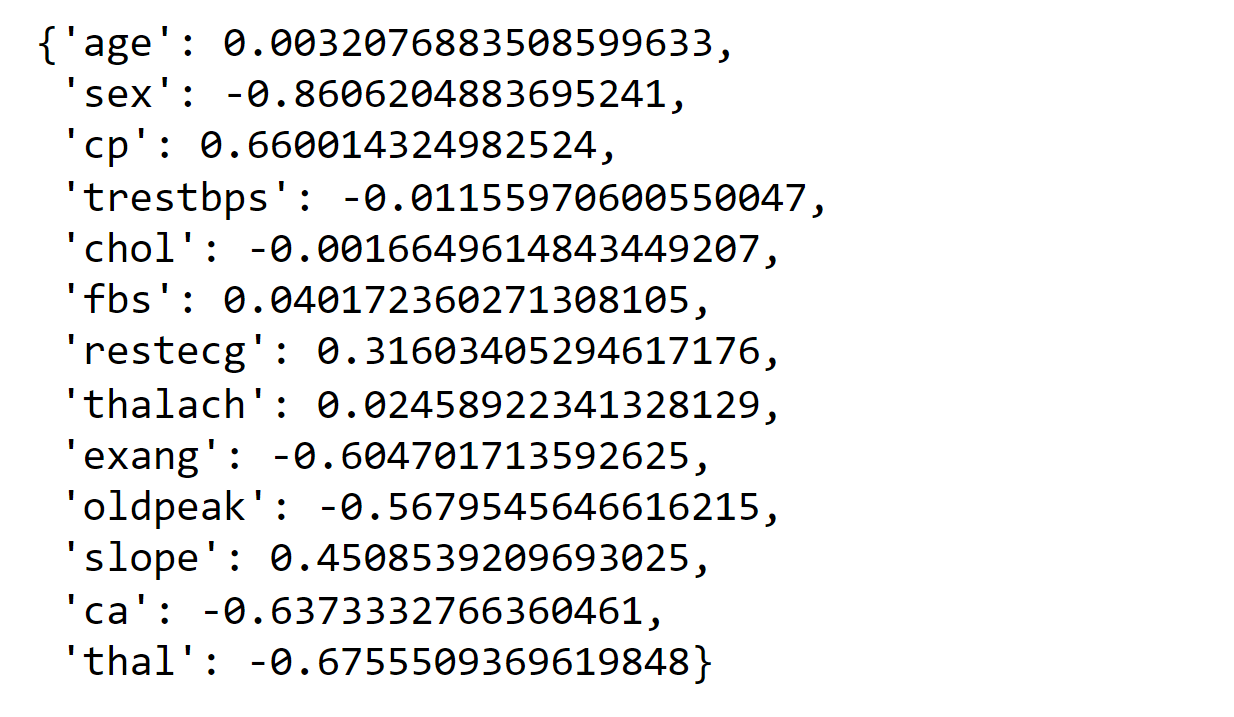
Output: 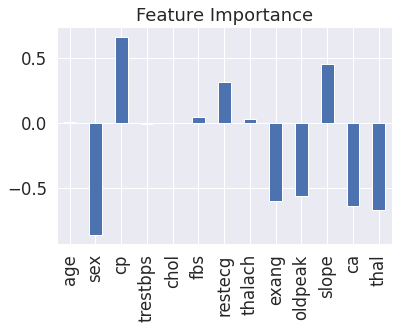
Based on the visualization,
have strong feature importance. On the other hand, sex has the least importance. Incorporating machine learning techniques for heart disease prediction presents a set of hurdles to overcome. These challenges encompass the necessity for extensive, varied, and carefully curated datasets, the possibility of biases within data acquisition, and the interpretability of the models themselves. Resolving these obstacles necessitates a cooperative effort among healthcare experts, data scientists, and regulatory entities to guarantee the ethical and efficient application of machine learning algorithms. ConclusionHeart disease prognosis utilizing machine learning stands as a notable stride forward in healthcare. Capitalizing on sophisticated algorithms and extensive data analysis, we are able to embrace forward-thinking and tailored methodologies in combating heart disease. As research and technological progress march on, it becomes imperative for stakeholders to unite, guaranteeing judicious execution, confronting obstacles, and maximizing the advantages of this revolutionary technology. By means of early identification and preventive measures, we endeavor to shape a future where global cardiovascular well-being experiences marked enhancement.
Next TopicOCR with Machine Learning
|
 For Videos Join Our Youtube Channel: Join Now
Feedback
- Send your Feedback to [email protected]
Help Others, Please Share


