Graph theory in Discrete MathematicsGraph theory can be described as a study of the graph. A graph is a type of mathematical structure which is used to show a particular function with the help of connecting a set of points. We can use graphs to create a pairwise relationship between objects. The graph is created with the help of vertices and edges. The vertices are also known as the nodes, and edges are also known as the lines. In any graph, the edges are used to connect the vertices. We can use the application of linear graphs not only in discrete mathematics but we can also use it in the field of Biology, Computer science, Linguistics, Physics, Chemistry, etc. GPS (Global positioning system) is the best real-life example of graph structure because GPS has used to track the path or to know about the road's direction. What is GraphA graph can be used to show any data in an organized manner with the help of pictorial representation. We can show the relationship between the variable quantities with the help of a graph. In graph theory, we usually use the graph to show a set of objects, and these objects are connected with each other in some sense. The objects can be described as mathematical concepts, which can be expressed with the help of nodes or vertices, and the relation between pairs of nodes can be expressed with the help of edges. 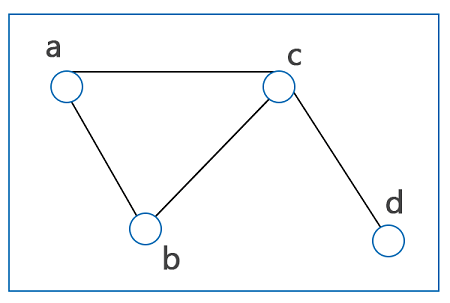
Leonhard Euler was introduced the concept of graph theory. He was a very famous Swiss mathematician. On the basis of the given set of points, or given data, he was constructed graphs and solved a lot of mathematical problems. He says that different types of data can be shown in various forms, such as line graphs, bar graphs, line plots, circle graphs, frequency tables, etc, with the help of graphical representation. Definition of Graph TheoryThe graph theory can be described as a study of points and lines. Graph theory is a type of subfield that is used to deal with the study of a graph. With the help of pictorial representation, we are able to show the mathematical truth. The relation between the nodes and edges can be shown in the process of graph theory. Formally, a graph can be represented with the help of pair G(V, E). Where V is used to indicate the finite set vertices and E is used to indicate the finite set edges. Hence, the graph basically contains the non-empty set of edges E and set of vertices V. For example: Suppose there is a graph G = (V, E), where V = {a, b, c, d}, and E = {(a, b), (a, c), (b, c), (c, d)}. Types of Graph:There are basically two types of graphs, i.e., Undirected graph and Directed graph. The directed graph and undirected graph are described as follows: Directed graph: The directed graph can be made with the help of a set of vertices, which are connected with the directed edges. In the directed graph, the edges have a direction which is associated with the vertices. 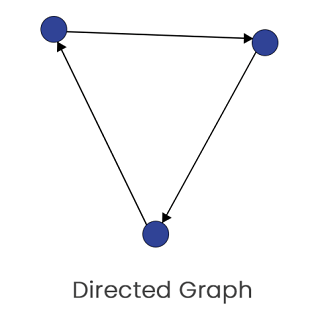
In the above-directed graph, arrows are used to show the direction. Undirected Graph The undirected graph can also be made of a set of vertices which are connected together by the undirected edges. All the edges of this graph are bidirectional. We can sometimes call this type of graph an undirected network. 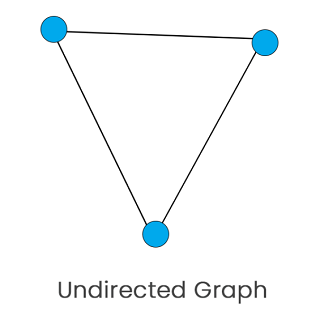
In the undirected graph, there is no arrow. Other types of graphThere are also some other types of graphs, which are described as follows: Null Graph: A graph will be known as the null graph if it contains no edges. With the help of symbol Nn, we can denote the null graph of n vertices. The diagram of a null graph is described as follows: 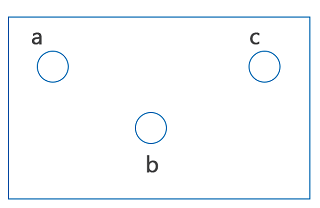
In the above graph, vertices a, b and c are not connected with any edge, and there is no edge. So this graph is a null graph. Simple Graph: A graph will be known as a simple graph if it does not contain any types of loops and multiple edges. The simple graph must be an undirected graph. The diagram of a simple graph is described as follows: 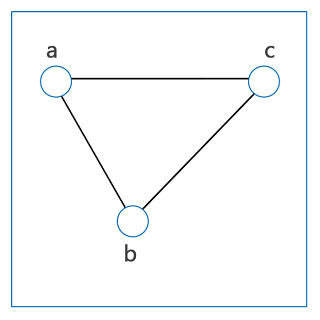
The above graph is an undirected graph and does not contain a loop and multiple edges. So this graph is a simple graph. Multi-Graph: A graph will be known as a multi-graph if the same sets of vertices contain multiple edges. In this type of graph, we can form a minimum of one loop or more than one edge. The diagram of multi-graph is described as follows: 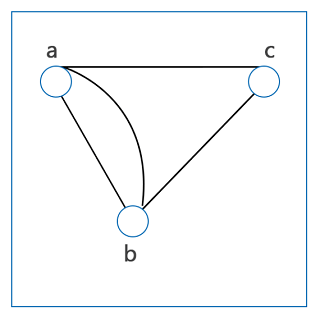
In the above graph, vertices a, b, and c contains more than one edge and does not contain a loop. So this graph is a multi-graph. Connected Graph: A graph will be known as a connected graph if it contains two vertices that are connected with the help of a path. The diagram of a connected graph is described as follows: 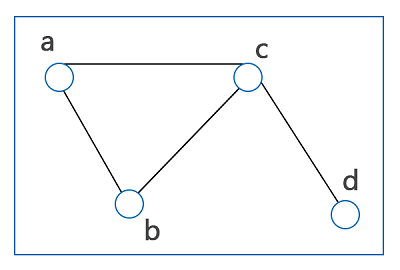
In the above graph, the two vertices, a and b, are connected by a single path. Similarly, other vertices such as (a and c), (c and b), (c and d), (a and d) are all connected by a single path. So this graph is a connected graph. Disconnected Graph: A graph will be known as the disconnected graph if it contains two vertices which are disconnected with the help of a path. If there is a graph G, which is disconnected, in this case, every maximal connected sub-graph of G will be known as the connected component of the graph G. The diagram of a disconnected graph is described as follows: 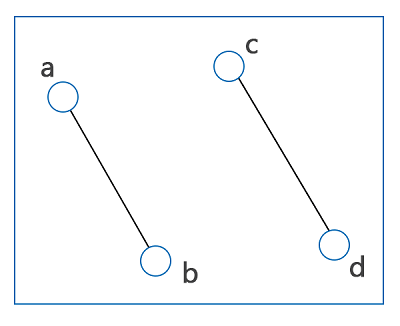
In the above graph, there are vertices a, c, and b, d which are disconnected by a path. So this graph is a disconnected graph. Cycle Graph: A graph will be known as the cycle graph if it completes a cycle. It means that for a cycle graph, the given graph must have a single cycle. With the help of symbol Cn, we can denote a cycle graph with n vertices. The diagram of a cycle graph is described as follows: 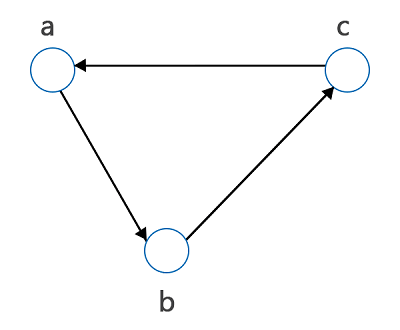
The above graph forms a cycle by path a, b, c, and a. So this graph is a cycle graph. Complete Graph: A graph will be known as the complete graph if each pair of vertices is connected with the help of exactly one edge. A simple graph will be a complete graph if there are n numbers of vertices which are having exactly one edge between each pair of vertices. With the help of symbol Kn, we can indicate the complete graph of n vertices. In a complete graph, the total number of edges with n vertices is described as follows: The diagram of a complete graph is described as follows: 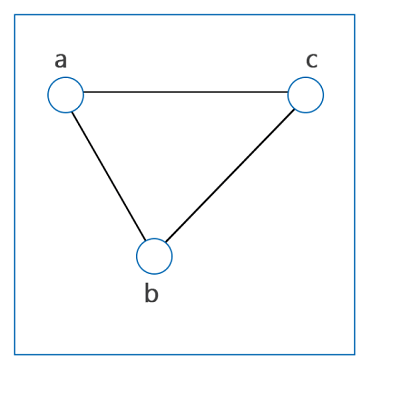
In the above graph, two vertices a, c are connected by a single edge. Similarly, all the other vertices (a and b), and (c and b) are connected by a single edge. So this graph is a connected graph. Planer Graph: A graph will be known as the planer graph if it is drawn in a single plane and the two edges of this graph do not cross each other. In this graph, all the nodes and edges can be drawn in a plane. The diagram of a planer graph is described as follows: 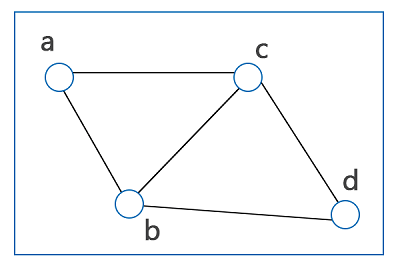
In the above graph, there is no edge which is crossed to each other, and this graph forms in a single plane. So this graph is a planer graph. Non-planer graph: A given graph will be known as the non-planer graph if it is not drawn in a single plane, and two edges of this graph must be crossed each other. The diagram of a non-planer graph is described as follows: 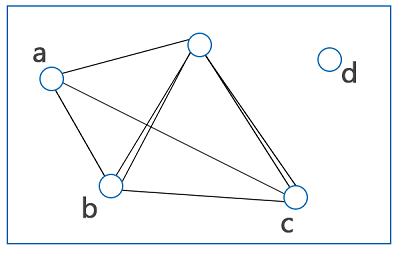
In the above graph, there are many edges that cross each other, and this graph does not form in a single plane. So this graph is a non-planer graph. Properties of a Graph
Tree, Degree, Cycle and many moreIn the graph representation, we can use certain terms, i.e., Tree, Degree, Cycle and many more. Now we will learn about them in detail. Trees: A tree is a type of graph which has undirected networks. The tree can have only one path to connect any two vertices. British mathematician Arthur Cayley was introduced the concept of a tree in 1857. The tree cannot have loops and cycles. The diagram of a tree is described as follows: 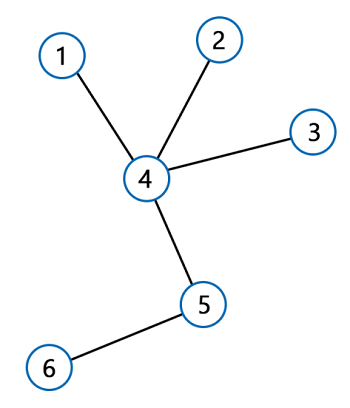
The above graph is an undirected graph which has only a path to connect the two vertices. So this graph is a tree. Degree: In any graph, the degree can be calculated by the number of edges which are connected to a vertex. The symbol deg(v) is used to indicate the degree where v is used to show the vertex of a graph. So basically, the degree can be described as the measure of a vertex. 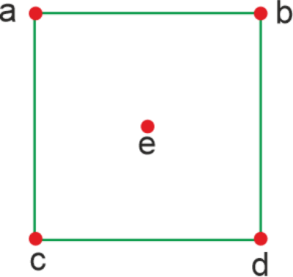
In the above graph, there are total of 5 vertices. The degree of vertex a is 2, the degree of vertex b is 2, the degree of vertex c is 2, the degree of vertex d is 2, and the degree of vertex e is zero. Cycle: In any graph, a cycle can be described as a closed path that forms a loop. A cycle will be formed in a graph if there is the same starting and end vertex of the graph, which contains a set of vertices. A cycle will be known as a simple cycle if it does not have any repetition of a vertex in a closed circuit. With the help of symbol Cn, we can indicate the cycle graph. The cycle graph can be of two types, i.e., Even cycle and Odd cycle.
The diagram of a cycle is described as follows: 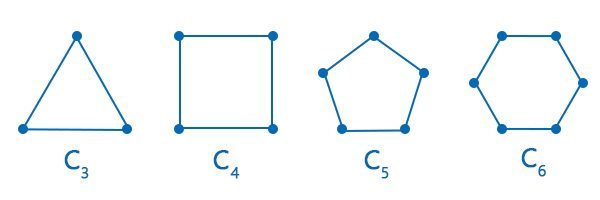
In the above graph, all the graphs have formed a loop, and if we start from any vertex, then we will be able to end the loop of the same vertex. That means in all the above graphs, the starting and end vertex is the same. So this graph is a cycle. Graph C3 and C5 contain the odd number of vertices and edges, i.e., C3 contains 3 vertices and edges, and graph C5 contain 5 vertices and edges. So graphs C3 and C5 contain the odd cycle. Similarly, graph C4 and C6 contain the even number of vertices and edges, i.e., C4 contain the 4 vertices and edges, and graph C6 contains the 6 vertices and edges. So graphs C4 and C6 contain the even cycle. Bipartite graph: A simple graph will be known as the bipartite graph if there are two independent sets which contain the set of vertices. The vertices of this graph will be connected in such a way that each edge in this graph can have a connection from the first set to the second set. That means the vertices of a first set can only connect with the vertices of a second set. Similarly, the vertices of a second set can only connect with the vertices of a first set. But this graph does not contain any edge which can connect the vertices of same set. The diagram of a bipartite graph is described as follows: 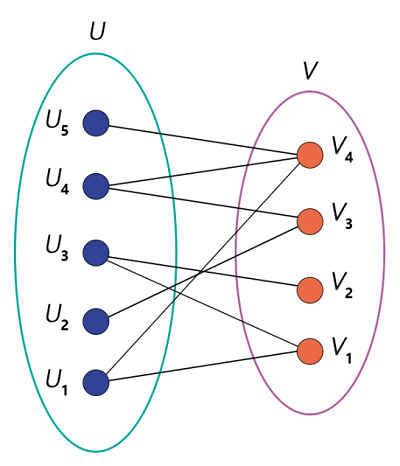
In the above graph, we have two sets of vertices. The Set U contains 5 vertices, i.e., U1, U2, U3, U4, U5, and the set V contains 4 vertices, i.e., V1, V2, V3, and V4. The vertices of set U only have a mapping with vertices of set V. Similarly, vertices of set V have a mapping with vertices of set U. Set U and set V does not have a connection to the same set of vertices. So this graph is a bipartite graph. Complete Bipartite graph A graph will be known as the complete bipartite graph if it contains two sets in which each vertex of the first set has a connection with every single vertex of the second set. With the help of symbol KX, Y, we can indicate the complete bipartite graph. That means the first set of the complete bipartite graph contains the x number of vertices and the second graph contains the y number of vertices. 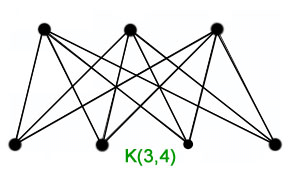
In the above graph, there are a total of two sets. The first set contains the 3 vertices, and the second set contains the 4 vertices. That means the value of x, y will be 3, 4. Every vertex of the first set has a connection with every vertex of a second set. So this graph is a complete bipartite graph. Wheels: A wheel and a circle are both similar, but the wheel has one additional vertex, which is used to connect with every other vertex. With the help of symbol Wn, we can indicate the wheels of n vertices with 1 additional vertex. In a wheel graph, the total number of edges with n vertices is described as follows: The diagram of wheels is described as follows: 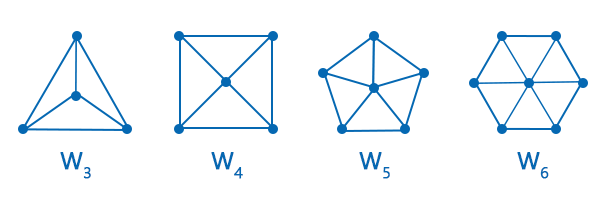
In the above diagram, we have four graphs W3, W4, W5, and W6. All the graphs have an additional vertex which is used to connect to all the other vertices. So these graphs are the wheels. Hypercube: Hypercube can also be called n cube. This hypercube is similar to a 3-dimensional cube, but this type of cube can have any number of dimensions. The hypercube is a compact, closed, and convex geometrical diagram in which all the edges are perpendicular and have the same amount of length. This cube contains the 2n vertices, and each vertex is indicated by an n-bit string. With the help of symbol Qn, we can indicate the hypercube of 2n vertices. In a cube graph, the total number of edges with 2n vertices is described as follows: The diagram of a hypercube is described as follows: 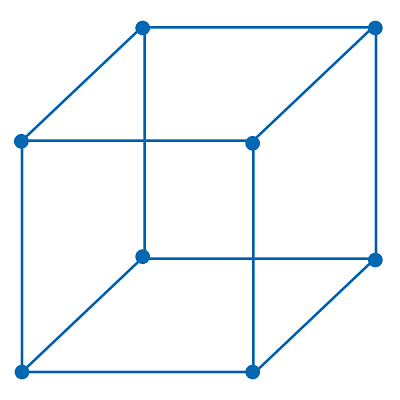
The above graph is compact and closed, and all the edges of this graph are perpendicular and have an equal amount of length. So this graph is a Hypercube. Algorithm of Graph TheoryThe algorithm of a graph can be defined as a process of calculating any function or the procedure of drawing a graph for any given function. If we want to solve the problem with the help of graphical methods, then we have to follow the predefined steps or sets of instructions. The graph theory follows the different types of algorithms, which are described as follows: Ford-Fulkerson algorithm: This algorithm is a type of greedy approach. In any graph or any network, we can calculate the maximum possible flow with the help of a Ford Fulkerson algorithm. This algorithm uses a term flow network, which can be used to show the vertices and edges of a graph with a source (S) and a sink (T). Here every edge must have a capacity. An equal amount of stuff can be sent by each vertex except S and T. This is because the S has the ability to only send, and T has the ability to only receive. With the help of following constraints, we can determine the maximum possible flow from s to t:
Bellman-Ford algorithm: The bellman ford algorithm can be described as a single shortest path algorithm. We can use this in a weighted graph where this algorithm will be used to determine the shortest path from a selected vertex to all other vertices. The Dijkstra algorithm and the Bellman ford algorithm are very similar. The main difference is that the bellman ford algorithm has the ability to work on the negatively weighted edges. This is because the Bellman ford algorithm has become very popular. Edmonds-Karp algorithm: This algorithm is also known as the maximum flow algorithm. This algorithm is a type of specific implementation of the Ford Fulkerson algorithm. The main difference between the Edmonds Karp algorithm and the Ford Fulkerson algorithm is that the Ford Fulkerson algorithm contains some parts of protocols which are left unspecified, and the Edmonds Karp algorithm is fully specified. There are different types of techniques in the Edmonds Karp algorithm so that it can determine the augmenting paths. This algorithm is used to deal with the problems related to max flow min cut. This algorithm is also used to show that we can determine the shortest distance at the time of intermediate stage of a program with the help of using breath first search. Boruvka's algorithm: This algorithm is used to determine the minimum spanning tree for a graph on the basis of the distinct edge weight. In this algorithm, the edges of the graph do not contain the same value. Boruvka's algorithm is the first algorithm which was developed in 1926 to determine the minimum spanning trees (MSTs). This algorithm is mainly used to connect the vertices with the help of shortest edge between the vertices.
Next TopicDiscrete Infinite Groups
|
 For Videos Join Our Youtube Channel: Join Now
Feedback
- Send your Feedback to [email protected]
Help Others, Please Share


