| |

Linear Graph in Discrete MathematicsWith the help of a straight line, we usually represent the linear graph. We indicate the relationship between two or more than two quantities with the help of a graphical form of representation. If we get a single line from a graph that contains any relation, then that graph will be called a linear graph. The meaning of "linear" is a straight line. So we can say that a linear graph is a type of straight-line graph that will be drawn on a plane that is connected with the help of points plotted on x and y coordinates. Definition of Linear graphA linear graph can be described as a graphical representation of a straight line. This graph is used to showcase a linear equation between the two variables, and it also indicates the linear association between two quantities. Now we will understand this concept by an example, which is described as follows: Harry gets a job in Xyz Company where he gets $15 per hour. His daily expenses are approx $50. So he is interested in knowing how many hours he should work per day in order to save some money as a saving. Now we will learn how we will get the solution to this problem with the help of a linear graph. Suppose we use t to indicate the time and l to indicate the income. In this case, we will get a linear equation as l = 15t. 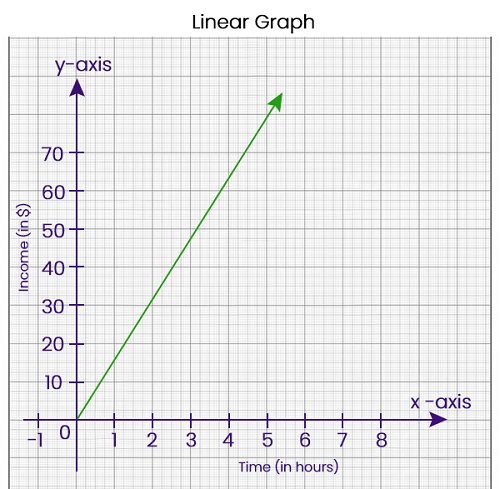
The above graph is a linear graph, and in this graph, we can see that the vertical axis's value is more than his spending, i.e., $50. With the help of values on the horizontal axis, Harry will know about the minimum number of hours he should work so that he can have savings per day. In the above graph, we can see that Harry will be managed to get earning upto $75 if he works 5 hours daily ($15 * 5hr = $75). In this case, he will be able to have the saving (75 - 50) of $25. Linear Graph VS Line GraphWith the help of following image, we will be able to see the difference between a linear graph and a line graph, which is described as follows: 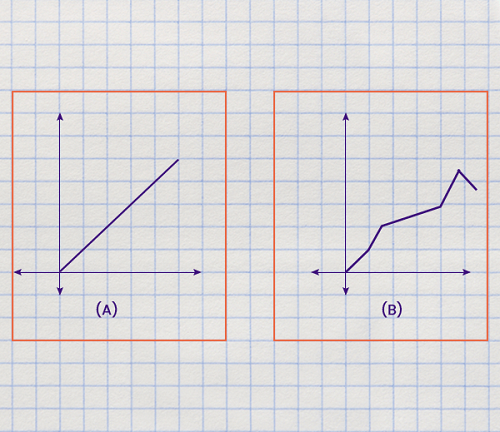
With the help of above example, we will learn how B is different from A? Here A is used to indicate the linear graph, whereas B is used to indicate the line graph. With the help of A and B, the line segments are made, but it has a major difference. By combining the line segments in the above diagram, we get the different lies. In a linear graph, we can see that all the points are collinear and hence lie on a line. But this type of collinear may or may not be contained by the line graph. Equation of Linear graphA linear graph can be described as a graphical representation of a linear equation. In the following form, we can write the linear equation, i.e., Ax + By = C. Here A, B, and C are used to indicate the real numbers, and these numbers must not be zero. For example: In the following way, we can indicate the linear equation 2x + 5y = 0 on a graph, which is described as follows: 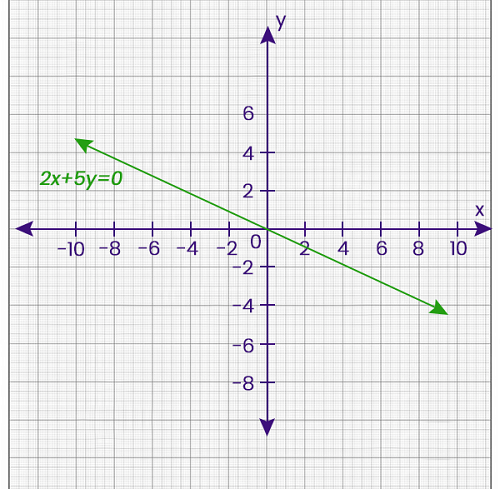
Plotting a Linear equation on GraphA linear equation can plot on a graph with the help of some steps, which are described as follows: Step 1: First, we will find out two quantities that vary. Step 2: In this step, we will assume x as the first quantity and y as the 2nd quantity. Step 3: In this step, we will determine three ordered pairs (x, y) that will satisfy the given equation. Step 4: Now, we will show these values in the form of tabular form. Step 5: Now, we will use these points from the table and draw them on a Cartesian plane. Step 6: In the last step, we will join all the points. For example: Suppose there is a linear equation 2x+y = 6, and we have to plot this equation on a graph. Solution: The above equation can be written in the form y = mx+b to plot it on a graph. So, y = -2x + 6 When we try to get the solution of the above linear equation, we have to plug it into a numerical value of x, and after plugging, we will get the corresponding values for it. Three corresponding values of solutions are described as follows:
Now we will use these points and plot them and join them on a xy plane like this:
Important Points
|
 For Videos Join Our Youtube Channel: Join Now
Feedback
- Send your Feedback to [email protected]
Help Others, Please Share


