| |

Linear Function in Discrete mathematicsA linear function can be described as a function that shows a straight line on the coordinate plane. Suppose there is a function y = 3x - 2, which shows a straight line on a coordinate plane. Hence this function is also a linear function. Since, we can replace y with f(x). So we can use another way to write this function, i.e., f(x) = 3x+2. In this section, we will learn about the definition, graph, domain, and range of the linear function. After that, we will learn to identify a linear function and find its inverse. Definition of Linear functionA linear function can be described as a function, which must be in the form f(x) = mx+b. In this equation, m and b are used to indicate the real numbers. This equation looks the same as the slope-intercept equation from a line, which is y = mx+b. They look similar because a linear function is used to represent a line. That means the graph of this function is a line. Here 'm' is used to indicate the slope of a line 'b' is used to indicate the y intercept of a line 'x' is used to indicate the independent variable. f(x) or 'y' is used to indicate the dependent variable. 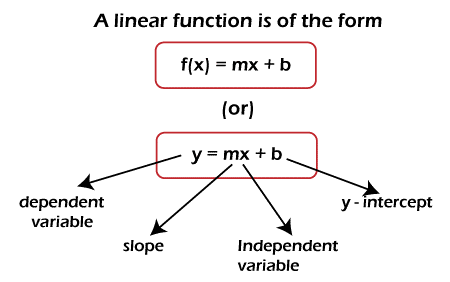
A linear function can be described as an algebraic function. Example and Equation of Linear functionThe parent linear function is indicated by f(x) = x, which is actually a line passing through the origin. In general, the equation of linear function is indicated as f(x) = mx + b. Some examples of linear function are described as follows: f(x) = 6x-5. f(x) = -7x - 0.7 f(x) = 4 Real-life example of Linear functionWe can also explain the linear function with the help of some real-life applications, which are described as follows:
Finding of Linear functionWe can find the linear function with the help of either point-slope form or the slope-intercept form. The process of determining a linear function and determining the equation of a line is similar, and we will explain this with the help of following example. Example: In this example, we have to determine the linear function, which contains two functions (-1, 15) and (2, 27). Solution: From the question, we have two points, i.e., (x1, y1) = (-1, 15), and (x2, y2) = (2, 27). Step 1: In this step, we will use the slope formula to determine the slope of the function like this: M = (y2-y1) / (x2-x1) = (27-15) / (2-(-1)) = 12 /3 = 4. Step 2: In this step, we will use the point slope form so that we can find out the equation of linear function like this: y - y1= m(x - x1) y-15 = 4(x-(-1)) y-15 = 4(x+1) y-15 = 4x+4 y = 4x+19 Therefore, the linear function equation is f(x) = 4x + 19. Identifying a Linear functionIf we get the information about a function in the form of a graph, and that graph is a line, then that function will be a linear function. If we get information about a function in the form of algebraic, which is in the form f(x) = mx+b, then that function will also be a linear function. If we want to check that the given data, which is represented in the table format, represents a linear function, then we can do this with the help of following steps:
Example: In this example, we have some data in the table, and we have to show whether this data represents a linear function.
Solution: To do this, we will calculate the differences in x values, y values, and ratio (difference in y) / (difference in x) every time, and from these calculations, we will see whether the ratio is a constant. 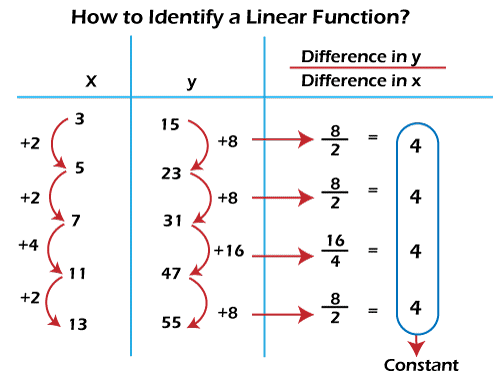
Graphing a Linear functionAs we know that we can graph a line with the help of any two points on it. When we are able to find those two points, then we need to just join them in a line and then extend them on both sides. The following things are contained by the graph of a linear function f(x) = mx+b When m>0, in this case, the graph will be an increasing line. When m<0, in this case, the graph will be a decreasing line When m<0, in this case, the graph will be a decreasing line. 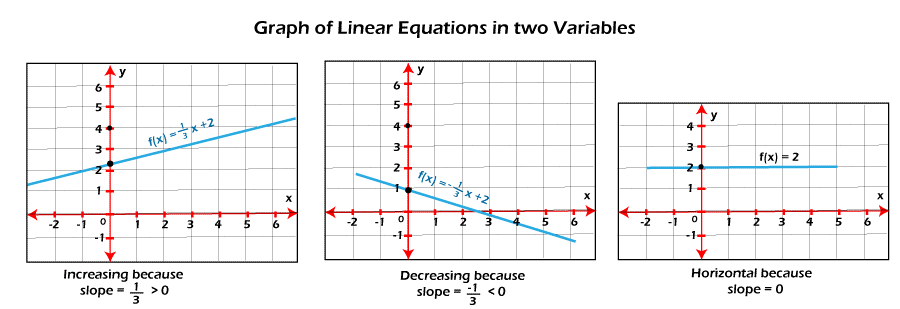
Graphing a Linear function by finding two points We will use the function f(x) = mx+b so that we can determine the two points on it. To do this, we will take some random values for x and find the corresponding value of y with the help of substituting these values on the function f(x). Now we will explain the process of graph a function with the help of an example in which we will graph a function f(x) = 3x + 5 like this: Step 1: In this step, we will use some random values to determine the two points on the line. So we will take two points as x = -1, and x = 0. Step 2: Now, we will find the corresponding y values with the help of substituting the above values of x in the function. In the following table, we can see the linear function y = 3x+5 like this:
Therefore, (-1, 2) and (0, 5) are two points on the line. Step 3: Now, we will plot these points on the graph and use a line to join them. We will also extend the line on left side and right side like this: 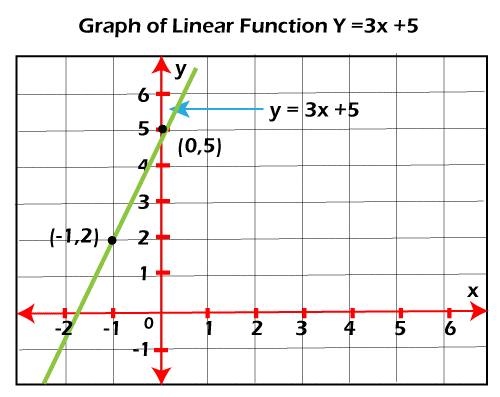
Graphing a Linear function using y-intercept and slope With the help of the y-intercept 'b' and slope 'm' of a linear function f(x) = mx+b, we can graph any function. Now we will explain the process to do this by again using the same linear function f(x) = 3x+5. The (0, b) = (0, 5) is used to show the y-intercept of this function, and m = 3 is used to show its slope. The steps/process to do this is described as follows: Step 1: In this step, we will plot the y-intercept (0, b), which is equal to (0, 5). So we will plot the points (0, 5). Step 2: Now, we have to write the slope in the form of a fraction rise/run and then find out the "rise" and "run". Here slope = 3 = 3/1 = rise/run So rise = 3, and run = 1. Step 3: In this step, we will get the new points by rising y-intercepts vertically with the help of "rise" and then run horizontally with the help of "run". Note: The graph will go up if the "rise" is positive, and the graph will go down if the "rise" is negative. Similarly, we will go right if the "run" is positive, and we will go left if the "run" is negative.In this graph, we will go up by 3 units from y-intercept and thereby go right by 1 unit. Step 4: Now, we will use a line to join the points from step 1 to step 2, and extend those lines on both sides. 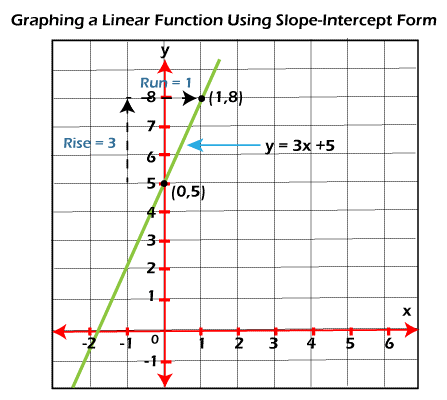
Domain and Range of a Linear functionA set of all real numbers is contained by the range and domain of a linear function. In the below image, we can see f(x) = 2x+3 and g(x) = 4-x both functions are plotted on the same axes like this: 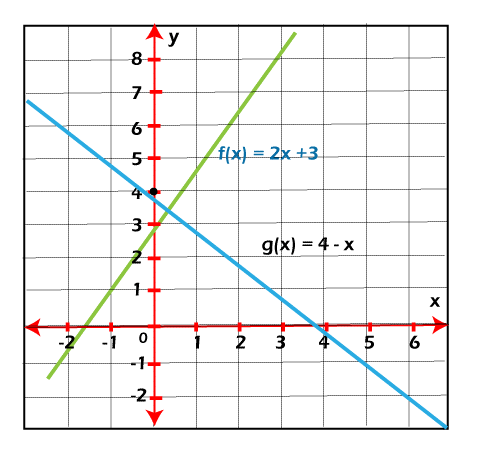
Here R is used to show the domain of a linear function, and R is also used to show the range of a linear function. Note:
Inverse of a Linear functionThe function f-1(x) is used to indicate the inverse of a linear function f(x) = ax+b in such a way that f(f-1(x)) = f-1(f(x)) = x. Now we will use an example to show the process to identify the inverse of a linear function. In this example, we have a linear function f(x) = 3x+5, and we will find the inverse of this function. Step 1: In the first step, we will replace f(x) with y. By replacing, we will get the following equation: y = 3x+5 Step 2: Now, we will interchange the variables x and y and get the following equation: x = 3y+5 Step 3: Now we will solve the above equation for y like this: x-5 = 3y y = (x-5) /3 Step 4: Now we will replace y by inverse function f-1(x), and get the following: f-1(x) = (x-5) /3 Note that the function f(x) and the inverse function f-1(x) are always symmetric with respect to line y = x. Now we will plot the linear function f(x) and its inverse function f-1(x). Here f(x) = 3x+5 and f-1(x) = (x-5)/3. Here we will check whether these functions are symmetric about y = x, and we will also see when (x, y) lies on f(x), then (y, x) lies on f-1(x). To prove this, we will take an example in which we have (-1, 2), which lies on f(x), and (-2, 1), which lies on f-1(x). The graphical representation of all these things is described as follows: 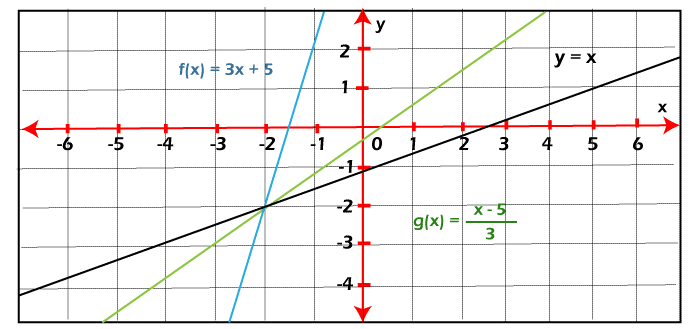
Piecewise Linear functionThere are some cases where the linear function is defined in a uniform way throughout its domain. This is because its domain can be split into two or more than two parts, so the linear function can be defined in two or more than two ways in some cases. This type of linear function is known as the piecewise linear function. The example of a piecewise linear function is described as follows: Example: In this example, we have a linear function, and we have to plot the graph of this function. The function f(x) is described as follows: 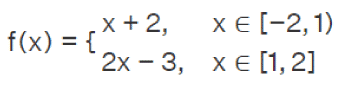
Solution: The above described piecewise function is linear in both the above described parts of its domain. Now we will determine the endpoint of the line by taking both the cases. When the case is x ∈ [-2, 1):
When x ∈ [1, 2):
The corresponding graph is described as follows: 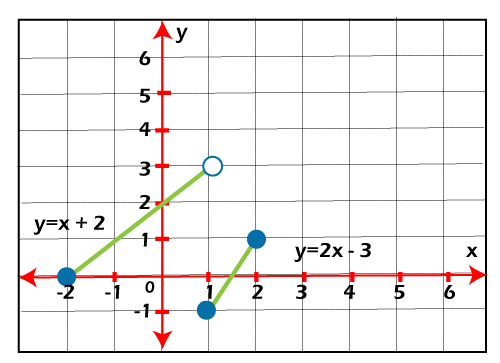
Important notes
|
 For Videos Join Our Youtube Channel: Join Now
Feedback
- Send your Feedback to [email protected]
Help Others, Please Share


