| |

How to Inspect the Memory in LinuxIntroductionIt is necessary that our Linux system executes at an excellent level. Some simple commands of the terminal give access to each corresponding information and support us monitor statistics. We will understand some of the important commands for checking the usage of memory in Linux in this topic. Also, we will give explanations in detail of what are they doing and more essentially how to illustrate the outputs. The commands will execute almost every distribution of Linux. The results and the commands are represented using Ubuntu 20.04 version. Prerequisites
Commands for checking the usage of memory in Linuxcat command to display Linux memory detailsTyping cat /proc/meminfo in our command line opens a file, i.e., /proc/meminfo. It is a virtual file that tells the amount of used and available memory. It includes real-time details about the memory of the system as well as the shared and buffer memory used via the kernel. The result may differ according to the operating system and architecture slightly. It is an instance of what the file, i.e., /proc/meminfo looks like in Linux Ubuntu 20.04: 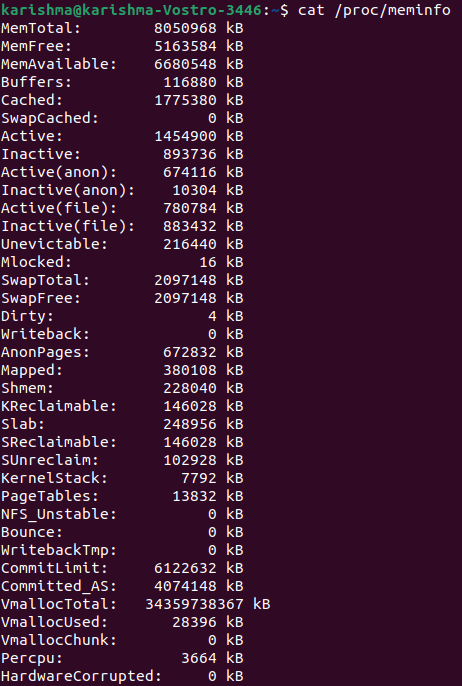
Note: The command line shows the details in Kbs.What is /proc/meminfo?In a few cases, the commands get the information with the help of a file named /proc/meminfo. We can read this file directly by using a command, i.e., less /proc/meminfo. We can scroll down and up through that output for finding what we need exactly with the help of the less command. One thing we must learn about the /proc/meminfo file is that it is not an actual file. Rather the /proc/meminfo file is a virtual file that includes dynamic and real-time details of the system. We will wish to inspect the values for in particular:
If we wish to get fancy with the /proc/meminfo file, we can apply it in conjunction using the egrep command. MemTotal: It describes total RAM which is usable (apart from some reserved bits and the binary code of the kernel). MemFree: It specifies The sum of HighFree+LowFree. Currently, the RAM amount present. MemAvailable: It defines estimated memory exist to begin new applications with no swapping. Buffers: It specifies temporary storage for disk blocks (raw). It will reduce the input and output of the hard drive. Also, it speeds up access for consecutive requests for similar data due to it is already within the memory. Cached: It specifies cached pages read through files over the hard drive (except SwapCached). SwapCached: It describes the memory that was back in and swapped out. A copy will remain within the swap space. Inactive: It addresses the memory that is been used. However, it should not be used most recently. Likely, it is an applicant for reclamation. Active: It addresses the memory that is been used recently. It is not reclaimed if not essential. Inactive (anon): It defines the amount of shmem, tmpfs, and anonymous memory that is an applicant for eviction (or memory reclamation). Active (anon): It defines the memory that is allocated to the files made inside the tmpfs pseudo-file system. Besides, anonymous files do not locate on the hard drive. Inactive (file): It describes the file cache memory amount read through any hard drive that's an applicant to reclaim. Active (file): It defines the file cache memory amount in use. Also, this file has been used from the previous cycle of memory reclamation. Unevictable: It addresses the memory amount that must be evictable. However, it is not evictable because it is locked within the memory via user-space processes. Mlocked: It defines the total memory amount as not evictable due to it is locked via many user-space processes. HighTotal: It defines the total HighMem amount. It is used by page cache and user-space programs. The kernel can authorize this memory zone. Although, it is not very fast for it to authorize than LowMem. HighFree: It describes the free HighMem amount. LowTotal: It defines the LowMem amount. It is present for every similar use as HighMem and also to use for the kernel for its purposes. LowFree: It describes the free LowMem amount. MmapCopy: It defines the memory amount that is been mapped to the file data. SwapFree: It addresses the swap space amount that is unused currently. SwapTotal: It addresses the swap space amount available. Dirty: It defines the memory amount delaying to be written back to a disk. Writeback: It describes the memory which is being actively written back to a disk. AnonPages: It describes backed pages (non-file) mapped into the page tables of user-space. Mapped: It defines files (such as libraries) that can be mapped into the memory. Shmem: It represents the consumed memory amount inside the tmpfs pseudo-file systems. Slab: It describes the cache of in-kernel data structures. KReclaimable: It represents the memory allocations of the kernel that the kernel would attempt for reclaiming when the memory demand is severe enough. SReclaimable: It describes the Slab memory amount that may be reclaimed like caches. SUnreclaim: It defines the Slab memory amount to the page table's lowest level. KernelStack: It addresses the memory amount which is allocated to the kernel stacks. Quicklists: It is vital and it is as fast as possible because the deletion and allocation of page tables is a very quick operation. Hence, the pages utilized for page tables can be cached in a different list number known as "quicklists". PageTables: It defines the memory amount dedicated to the page table's lowest level. NFS_Unstable: The Network File System pages that are received by the server, but not written to the non-volatile storage yet. Bounce: It defines the memory utilized for block device bounce buffers. The bounce buffer can be placed in memory enough low for a device for directly accessing it. Then, the data will be copied to the chosen user page within HighMem. WritebackTmp: It defines the memory which is used via Filesystem in Userspace (or FUSE) for write-back buffers (temporary). CommitLimit: It describes the total memory amount available currently to be allocated within the system. Committed_As: It represents the memory amount estimated for satisfying every current demand. When a program requests a few RAM, this request will be recorded, the RAM is allocated at the time the program begins to use it only. VmallocTotal: It defines the total vmalloc memory area size. VmallocUsed: It describes the vmalloc area amount used. This option is no longer measured since Linux 4.4 version because it is hard-coded. VmallocChunk: It represents the largest area of free vmalloc contiguous block. HardwareCorrupted: It defines the memory amount tagged as including problems of physical memory corruption. It would not be allocated. AnonHugePages: It addresses the backed huge pages (non-file) mapped into the page tables of user-space. The backed pages (non-file) did not come from any hard drive file. LazyFree: It defines the memory amount in the state of the MADV_FREE. If the application fixes the MADV_FREE flag over a page range. It illustrates it no longer needs them and they are reclamation applicants now. The original reclamation may be delayed until there is enough memory demand. When the application begins to write for pages, the reclamation could be canceled. ShmemPmdMapped: It defines the shared memory amount which is mapped into userspace using huge pages. ShmemHugePages: It defines the memory amount which is used by the pseudo-file systems (tmpfs) and shared memory (shmem) allocated using huge pages. CmaTotal: It describes CMA (Contiguous Memory Allocator) pages amount. These pages are used via devices that could communicate only to contiguous memory regions. Hugepagesize: It defines huge pages size. HugePages_Surp: It represents a huge page number within the pool above the specified value. HugePages_Free: It addresses huge pages number (unallocated) within the pool. HugePages_Total: It describes the size of a huge page pool. DirectMap1G: It defines bytes number of RAM which is mapped to the pages of 2GB. DirectMap2M: It represents bytes number of RAM which is mapped to the pages of 2MB. DirectMap4M: It describes bytes number of RAM which is mapped to the pages of 4MB. DirectMap4k: It addresses bytes number of RAM which is mapped to the pages of 4kb. free command to show the amount of Swap and Physical MemoryEntering free in our command line gives the following output: 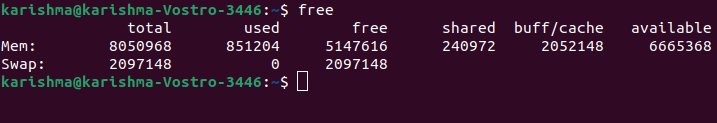
The data illustrates the swap memory and available or used memory figures in KBs.
The free command facilitates less information as compared to the file, i.e., /proc/meminfo. However, it's easier to learn. The important figure being the available value as it shows how much memory is present to run new applications. Also, the free command contains more than one option for formatting the result. Hence, it better matches our needs. The following table lists the helpful versions of the free command. - k: result in kilobytes -b: result in bytes - m: result in megabytes - g: result in gigabytes - o: old format (no +/-buffers/cache line) - l: detailed high and low memory statistics - c: update [count] times - s: update all [delay] seconds - t: total for swap + RAM Note: Typing man free shows the descriptions of the outputs and overview of each variation as with almost every command.The vmstat command for Reporting statistics of Virtual MemoryThe vmstat command is helpful that is used for reporting statistics of virtual memory. The vmstat command gives basic details of CPU activity, traps, block IO, paging, memory, and processes. Syntax: 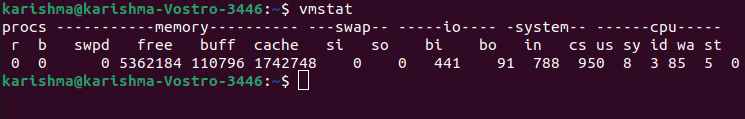
The detailed description mentioned below gives an explanation for all values in case we need assistance to analyze the outputs. Procsb: processes number in sleep (uninterruptible) r: processes number remaining because of run time Memorycache: the memory amount used as cache. buff: the memory amount used as buffers. free: an idle memory amount. swpd: the used amount of virtual memory. Swapso: memory swapped to the disk (/s). si: memory swapped in through the disk (/s). IObo: Blocks transferred to the block device (block/s). bi: Blocks received through the block device (block/s). Systemcs: context number switches per second. in: interrupt numbers per second along with the clock. CPU- These are total CPU time percentages.us: Time spent executing the code of non-kernel (user time along with nice time). id: Time used idle. It includes the wait time of IO before the Linux version 2.5.41. sy: Time spent executing the code of kernel (system time). st: Time stole through a virtual system. It was unknown before the Linux version 2.6.11. wa: Time spent remaining for IO. It was included in idle before the Linux version 2.5.41. The top command for checking the usage of memoryThe top command is helpful for checking the usage of CPU and memory per process. It shows details about:
The data is updated continuously, which permits us to pursue the process in real-time. 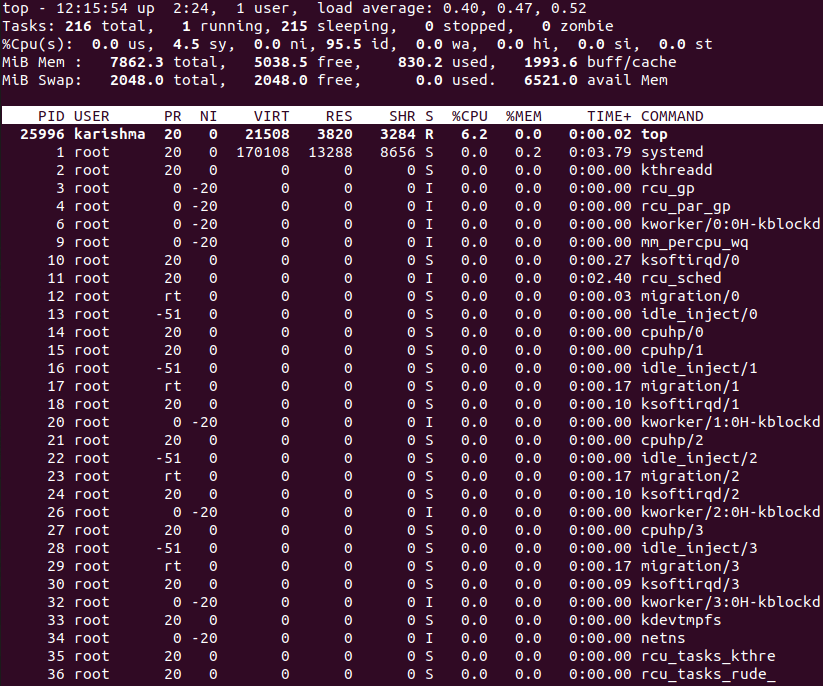
Aside from giving us necessary memory details, the top command facilitates a limited interface for interaction. It is possible to employ and construct operations by applying many options of the command line. In Linux, the man command, i.e., man top gives available variations comprehensive list. Here are the details we will find on all lines: First line: It specifies the time, how long the system has been executing, what has the load average been over the 15, 5, and 1 minute, and how many users are logged in. Second line: It defines the number of operations and their states: zombie, sleeping, stopped or running. Third line: It gives the information of the CPU. Fourth line: It defines the total physical memory amount, and how much memory is cached, buffered, used, or free. Fifth line: It describes total swap memory amount, and how much memory is available, used, and free (taking into memory that is expected to be rectifiable from caches). Various fields of CPU on the third line are described below: sy: It is the time that the CPU spent executing system processes of kernel space. us: It is the time that the CPU spends running processes to users in the userspace. ni: It is the time that the CPU spent running processes using a nice value (manually set). id: It defines CPU idle time. wa: It is the time that the CPU spends delaying for I/O to end. hi: It is the time that the CPU spent servicing the interruptions of hardware. si: It is the time that the CPU spent servicing the interruptions of software. st (steal time): It is the time that the CPU lost because of executing virtual machines. We might need to click the right or left arrow buttons to check every column. The values in all the columns are mentioned as follows: PID: It is the Process ID. PR: It is short for Process Priority. USER: It defines the name of the process owner. NI: It specifies the process's nice value. RES: It stands for resident memory which is applied by a process. VIRT: It stands for virtual memory which is applied by a process. SHR: It stands for shared memory which is applied by a process. S: It addresses the process status. %MEM: It defines the physical memory share used. %CPU: It defines the CPU time share which is applied by a process from the last update. COMMAND: It addresses the Command name or line (options + name). TIME+: It specifies the total time of CPU which is applied by an operation in 100ths of a second. The status shown in the S column could be any one of the below: D: Uninterruptible sleep. S: Sleeping R: Running Z: Zombie T: Traced (stopped) The htop command to check Process Memory LoadThe details which are given by the htop command are the same as the top command. But, the actual aspect of the top command is its improved controls and user-friendly environment. The command applies color for its result, gives the command line completely for processes, and the options for scrolling both horizontally and vertically as well. Syntax: 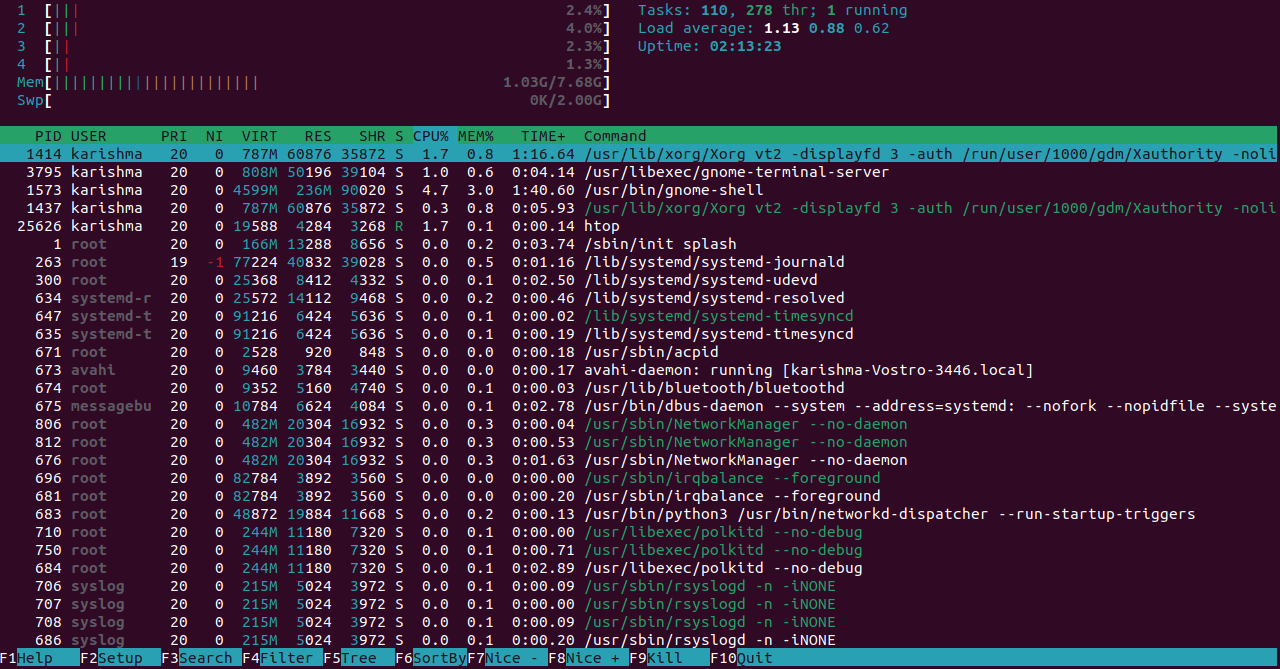
The top section includes text counters and graphic meters. Also, it gives summary information. The lower segment designs the detailed information per process. It permits us to implement actions on a single process with ease. Many shortcuts mentioned at the screen's bottom part will enable us to quickly employ and personalize the processes and with no requirement to type particular commands. Note: If we run into a message, i.e, "Command htop not found" if trying to execute the htop command, first, we will require to install a htop function: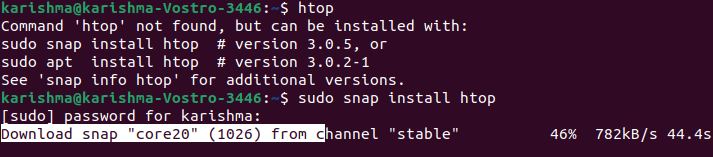
Apply the following command as an alternative: 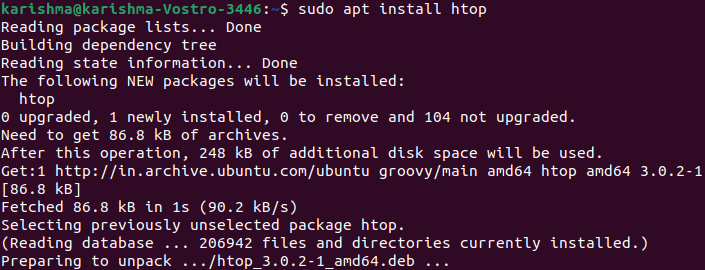
Checking the Usage of Memory using the GUI in LinuxFor server administration, using a GUI is not a basic practice. But, certain sets of data are much visible with the memory usage visual representation. For accessing the System Monitor: 1. Operate the Show Applications. 2. Type System Monitor within the search bar and access the application. 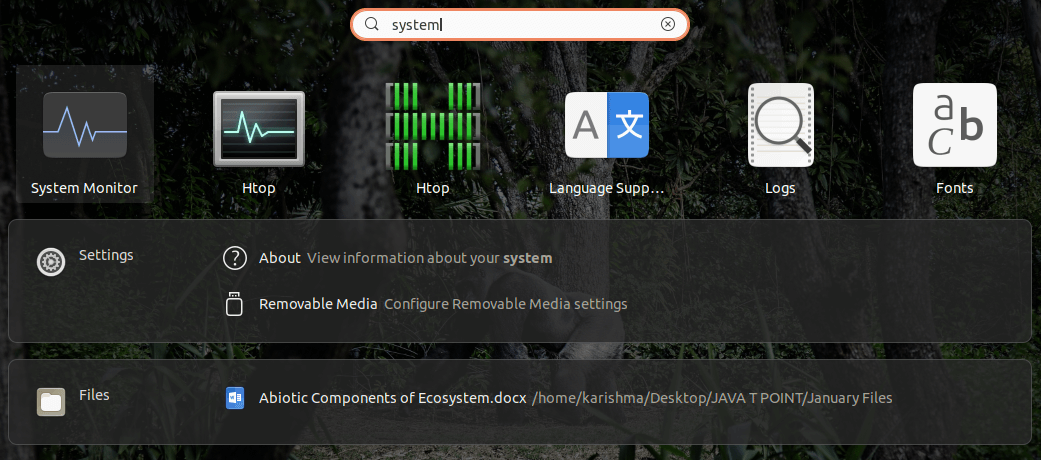
3. Choose the Resource tab. 4. An overview (graphical) of the consumption of our memory in real-time along with historical details are displayed. 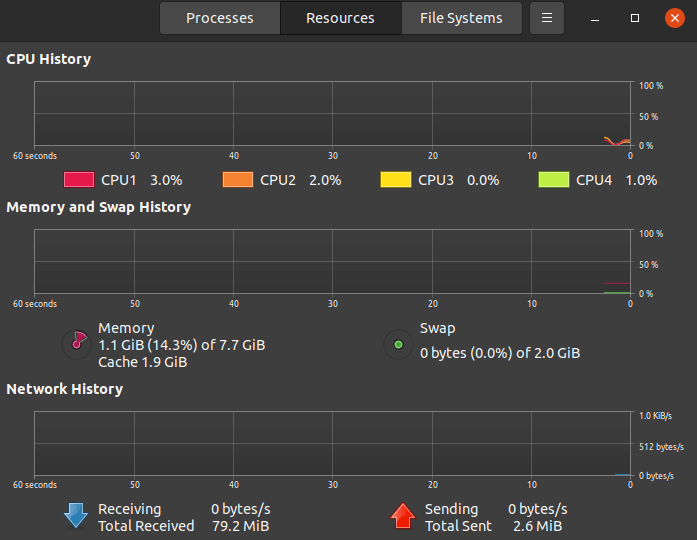
dmidecodeIf we wish to check out complete information of our installed system RAM, we can apply the dmidecode command. It is a DMI table decoder. It dumps the DMI table contents of a system into a user-readable format. The DMI table is a means for describing what a system is designed of (possible evolutions for any system as well). We require sudo privileges for running the dmidecode command. So, we can execute the dmidecode -t 17 command. The result of this command could be lengthy because it shows details for each memory-type device. Example: 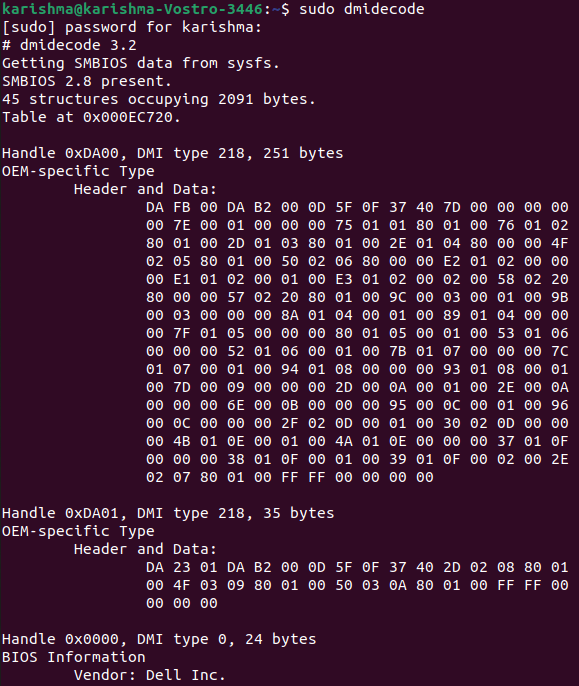
How Linux utilizes RAMRAM is a limited resource that every process, such as daemon and application, wishes a part of. There is only a lot of it present. The kernel judges the memory allocates and squabbles the rationed memory out to every hungry process. Unused RAM is exhausted RAM. Linux applies a spare RAM for many things such as buffer space for keeping our system executing at optimum performance.
Next TopicUbuntu GNOME
|
 For Videos Join Our Youtube Channel: Join Now
Feedback
- Send your Feedback to [email protected]
Help Others, Please Share


