| |

Linux Load AverageIf we are using any Linux server, we are familiar with the system load or load average term. Measuring the system load or load average is typical to understand how our servers are working; if overload, we need to optimize or kill the processes that are consuming high resource amounts, or give other resources for balancing the workload. Then the question is, how do we determine if our server has enough load capacity, and when must we be worried? In this article, we are going to discuss one of the typical Linux system administration operations-performance monitoring regarding load average and CPU/system load. Before we discuss anything, let's know these two essential terms in each Unix-like systems:
The load-average in Linux is technically assumed to be the process's running average in its execution queue that is tagged as uninterruptible or running. Note:
Load Average IntroductionThe load average can be defined as an average system load over the Linux server for a specified time. Besides, it is a server's CPU demand that contains the sum of the waiting and the running threads. The uptime or the top command will typically facilitate the load average of our server along with result that looks like below: These numbers are the system load averages over a time of fifteen, five, and one minute. Before continuing with how to measure the output of the system load average and what all of the values mean, we should provide a simple example, i.e., a server using one core processor. Load Break DownA server using one core processor is the same as an individual customer's line waiting for getting their products billed within a grocery shop. Usually, there is a long line during peak hours as well as the waiting time is high for all the individuals. If we wish to save the waiting time, an essential metric will be the people waiting during a specific time. When there are no people waiting, the waiting time will be zero. Besides, When there is a customer's long line, the waiting time will be high. Using that to the system load result (0.5, 1.5, 3.0):
Multiprocessors and multicores to the rescueRelatively, a server and one quad-core processor with four processors are the same. The primary difference between multiprocessor and multicore is that a former defines one CPU as having more than one cores. Besides the latter defines more than one CPUs. Two dual cores are equivalent to a single quad-core which is equivalent to four individual cores. The system load is corresponding to the cores present inside the server and also not how they're spreading out on the CPUs. It defines that the maximum range of utilization is 0 to 1 for one core, 0 to 2 for dual-core, 0 to 4 for quad-core, 0 to 8 for octa-core, and more. Multi-processor: It is where more than two physical CPUs can be developed into one computer system. Multi-core processor: It is one physical CPU. It has at least more than two separate cores that implement in parallel. Furthermore, there is a technology of processor as well which was initially introduced by Intel for improving parallel computing. It is known as hyper threading. One physical CPU core illustrates as two logical CPU core to an OS under hyper threading. However, there is a single physical hardware element in reality. Note: One CPU core can carry out only a single task at a moment. So, technologies like hyper threading, multi-core CPUs, multiple processors/CPUs were brought to life.Various programs could be run simultaneously with multiple CPUs. Present-day CPUs of Intel use a set of both hyper threading and multiple cores technology. We can use the lspu or nproc command for finding the processing unit's numbers present on the system: 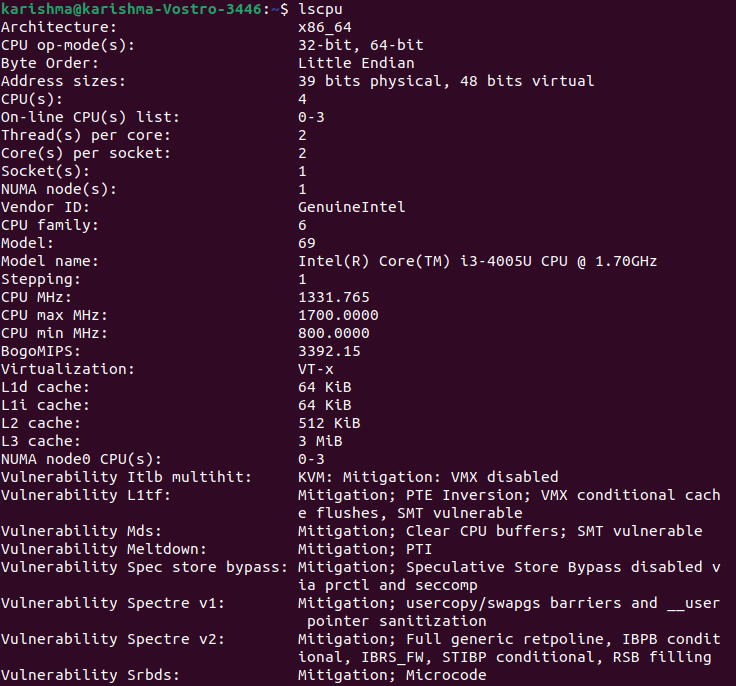

Monitoring System Load/Load Average (Site24*7)Adding resources for the higher load value may add to out costs of infrastructure. It is ideal to efficiently handle the load and manage the optimum level for avoiding server performance degradation problems. In Linux, the Site24*7 monitoring feature monitors the system loads among 60+ performance metrics and gives the 15, 5, and 1 minute average values within an easy-to-understand and intuitive graph. Further, we can receive notifications and set thresholds if there is any breach. Site24*7 facilitates an IT automation set for fault resolution (automatic). For example, if the threshold of load average is set to the 2.90 value for a dual-core processor, we can add server commands and upload a server script for killing the process utilizing the CPU (highest) if the threshold has been breached. Using this way, the problem can be solved and the MTTR (mean time to repair) is reduced vastly. How to calculate Load AverageThere are several ways to monitor the load average of a system including the uptime command which illustrates how long a system has been executing, total users together along with the load averages: 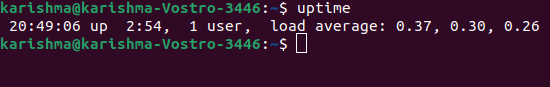
The numbers are considered from the left side to the right side. A high load average indicates that the system is overloaded. It means various processes are delayed for CPU time. Top Command 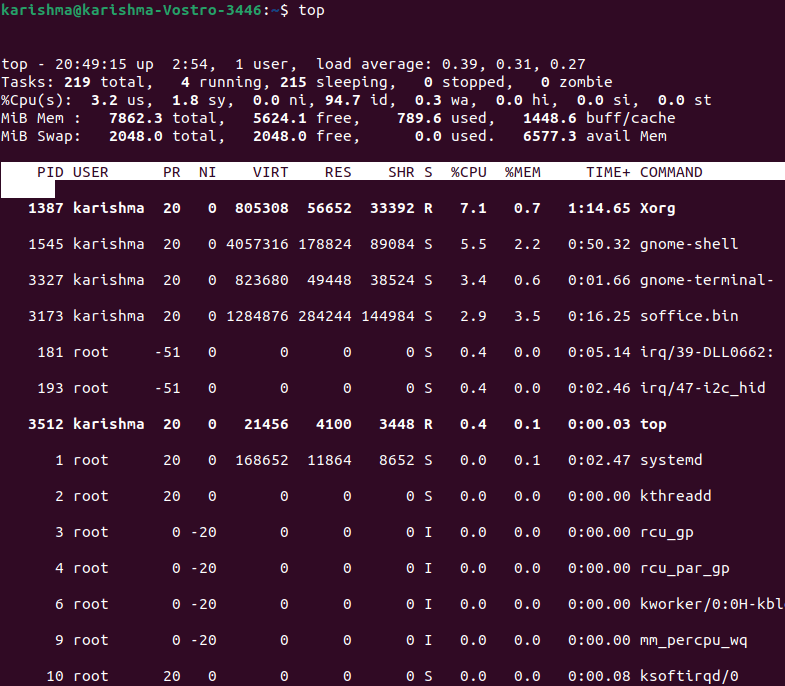
This command is used for showing the running processes of Linux. Glances Tool It is a System monitoring tool of Linux. Other Commands of System PerformanceSome of the commands to assess the performance of the system are mentioned below:
CPU Utilization vs CPU LoadThe study of distinct load indices provided by Ferrari et al. represents that the information of CPU load is based on the length of the CPU queue does better in the load balancing process than CPU utilization. The cause behind the length of the CPU queue did better is possible because if the host is loaded heavily, the CPU utilization is near to 100% ad it can't reflect the level of load amount. In contrast, The lengths of the CPU queue could directly reflect the load amount over a CPU. For example, two systems (one using 3 and one using 6 processes within the queue) are likely to include utilizations near to 100%. However, they differ obviously. Wrapping upIncluding more cores may accelerate the performance of our server, but may also include on to our infrastructure spending. Consistently, monitoring the system load for maintaining efficient management of the available setup could be a good alternative. Besides, the Site24*7 Server Monitoring not just monitors the system load, but also gives tools for complementary fault resolution for acting before a high system load impacts the performance of the server.
Next TopicLinux Firewall
|
 For Videos Join Our Youtube Channel: Join Now
Feedback
- Send your Feedback to [email protected]
Help Others, Please Share


