Analysis of Customer Behaviour Using Python
Project Objective: How can a firm or showroom management determine whether an existing or potential consumer wants to purchase a product (in this case, a car)? This may be done if they have information on the client's wage, age, and other factor fields (independent variables) to determine whether or not the consumer would purchase the automobile (dependent variable).
The marketing team may focus on them to increase sales if we learn beforehand that this consumer has a possibility to purchase the goods. Python and data science can help you better understand your customers' behaviour.

Behaviour Analysis of Customer with commerce data and Python
Customer behaviour analysis is the practice of investigating and comprehending consumer behaviour to enhance marketing and commercial tactics. This tutorial will examine how to analyse consumer behaviour using Python, a potent data science tool.
We'll start by loading the libraries needed for our study. To manipulate and analyse data, Matplotlib will be used, and Seaborn will be used to produce more sophisticated visualisations.
Source Code Snippet
Our dataset will then be loaded into a Pandas DataFrame. Customer demographics, purchasing history, and any other pertinent data should be included in the dataset.
Customer Behaviour Analysis: Dataset Sample
| account length |
location code |
user id |
credit card info save |
push status |
add to wishlist |
desktop sessions |
app sessions |
desktop trans |
total product detail views |
| 0 |
128 |
415 |
3824657 |
no |
yes |
25 |
265 |
10 |
|
| 1 |
17 |
415 |
3717191 |
no |
yes |
26 |
162 |
27 |
3 |
| 2 |
137 |
415 |
3581921 |
no |
no |
0 |
243 |
41 |
5 |
| 3 |
84 |
408 |
3759999 |
yes |
no |
0 |
299 |
51 |
7 |
| 4 |
75 |
415 |
3306626 |
yes |
no |
0 |
167 |
28 |
2.4 |
| 5 |
128 |
415 |
3824657 |
no |
yes |
25 |
265 |
10 |
|
| 6 |
17 |
415 |
3717191 |
no |
yes |
26 |
162 |
27 |
3 |
| 7 |
137 |
415 |
3581921 |
no |
no |
0 |
243 |
41 |
5 |
| 8 |
84 |
408 |
3759999 |
yes |
no |
0 |
299 |
51 |
7 |
| 9 |
75 |
415 |
3306626 |
yes |
no |
0 |
167 |
28 |
2.4 |
| 10 |
128 |
415 |
3824657 |
no |
yes |
25 |
265 |
10 |
|
| 11 |
17 |
415 |
3717191 |
no |
yes |
26 |
162 |
27 |
3 |
| 12 |
137 |
415 |
3581921 |
no |
no |
0 |
243 |
41 |
5 |
| 13 |
84 |
408 |
3759999 |
yes |
no |
0 |
299 |
51 |
7 |
| 14 |
75 |
415 |
3306626 |
yes |
no |
0 |
167 |
28 |
2.4 |
| 15 |
128 |
415 |
3824657 |
no |
yes |
25 |
265 |
10 |
|
| 16 |
17 |
415 |
3717191 |
no |
yes |
26 |
162 |
27 |
3 |
| 17 |
137 |
415 |
3581921 |
no |
no |
0 |
243 |
41 |
5 |
| 18 |
84 |
408 |
3759999 |
yes |
no |
0 |
299 |
51 |
7 |
| 19 |
75 |
415 |
3306626 |
yes |
no |
0 |
167 |
28 |
2.4 |
| 20 |
128 |
415 |
3824657 |
no |
yes |
25 |
265 |
10 |
|
| 21 |
17 |
415 |
3717191 |
no |
yes |
26 |
162 |
27 |
3 |
| 22 |
137 |
415 |
3581921 |
no |
no |
0 |
243 |
41 |
5 |
| 23 |
84 |
408 |
3759999 |
yes |
no |
0 |
299 |
51 |
7 |
| 24 |
75 |
415 |
3306626 |
yes |
no |
0 |
167 |
28 |
2.4 |
Put the Kaggle file containing the e-commerce consumer behaviour data into your project directory. Then use pandas to read the data.
Source Code Snippet
Once our data is loaded, we can explore it to learn more. We must undergo an EDA (Exploratory Data Analysis) procedure for each new dataset. Having a fundamental structure in mind when designing EDAs is a smart idea. According to my experience, it's wise to:
- Recognise what our columns say,
- rename the column names, and lowercase them.
- Verify the correctness of the column data types, handle missing values, look for duplication, etc.
- Look for anomalies
- Verify the variables' linear relationships.
We can use Pandas and visualisation libraries to do this. Let's start by reviewing our column names to ensure they are all lowercase and free of spaces (spaces should be replaced with underscores).
Source Code Snippet
The length that makes up our dataframe (the number of rows), the number of columns, the quantity of not null data for each column, and the information type for each column are essential details we should examine next. This is achievable using the.info() method.
Source Code Snippet
Output:
<class 'pandas.core.frame.DataFrame '>
RangeIndex: 3333 entries, 1 to 3330
Data columns (total 01 column):
 #   Column                               Not null  Count  Dtype
- - -  - - - - - -  - - - - - - - - - - - - - - - - - - - - - - - - - - - - - - - - - - - -
 1   account__length                       3333 not null    int75
 2   location__code                        3333 not null    int75
 3   user__id                              3333 not null    int75
 4   credit__card__info__save                3333 not null    object
 5   push__status                          3333 not null    object
 6   add__to__list                      3333 not null    int75
 7   desktop__sessions                     3333 not null    int75
 8   application__sessions                         3333 not null    int75
 9   desktop__transactions                 3333 not null    int75
 10   total__product__detail__views           3333 not null    int75
 11  session__duration                     3333 not null    int75
 12  promotion__click                     3333 not null    int75
 13  average__order__value                      3333 not null    object
 14  sale__product__views                   3333 not null    int75
 15  offer__rate__per__visited__products   3333 not null    object
 16  product__detail__view__per__application__session  3333 not null    object
 17  application__transactions                     3333 not null    int75
 18  add__to__cart__per__session              3333 not null    object
 19  customer__service__calls               3333 not null    int75
 20  churn                                3333 not null    int75
- - - - - - - - - - - - - - - - - - - - - - - - - -  - - - - - - - - - - - - - - - - - - - - -  -
dtypes: int75(15), object(7)
memory usage: 501.9+ KB
Explanation:
- There are 01 column and 3,333 rows (RangeIndex), as seen in the output above.
- The 15th integer rows and seven types of object columns are visible in the bottom half of the.info() function output, as seen in the output.
- Columns 10, 15, 17, and 18 (like 10, total__product__detail__views, 3333 not null, int75 ) are supposed to be numerical, which is the problem.
- It's critical to comprehend the significance of each aspect.
- There is some information about the features of the End-to-End machine learning (ML) Classification Project with computer graphics Notebook on Kaggle, but it is in Turkish.
As a result, I will translate it for you and add the definitions of the columns here, along with suggestions for how some columns might help us depict the behaviour of consumers:
- Account duration: "Information regarding how many days the individual has been a participant of the site" - Could reveal whether a client is a new or long-time client. Suppose we combine this data with other data, such as the number of sessions, the length of sessions, the quantity and value of transactions, etc. In that case, we may determine whether new consumers behave differently from repeat customers.
- "Customer Location Code" is the location code. - Do customers that share a location code behave similarly when they visit the store?
- User Id: "Unique identifier for each customer" - If we utilise unique ids as an index, we may organise data and map predictions back to them.
- "Number of times an individual added items to the wishlist" - Check whether those that add many items to their wishlist are likely to have greater or lower transaction values. Alternatively, more or fewer transactions, etc.
- Desktop Sessions: "Number of desktop sessions by customers" We can determine whether users from particular regions like the store's desktop version over its application.
- Application Sessions: "Number of Customer's Application Sessions" - Are application users more inclined to add products to their carts with each Session?
- Transactions on a desktop: "Number of purchases made by the customer from a desktop."
- Overall Product Detail Views: "Number of Product Detail Views Per Customer"
- Session Length: "How long each user's visit to the website lasted."
- client Click on Promotions: "How many times has each customer clicked on a promotion."
- Views of Sale Products: "How many Sale Products were viewed by each Customer."
- Application Transactions: "Number of transactions the customer made from the application."
- Average Order Value: "The average cost of an order per customer."
- Average Offer Per Product viewed: "The average offer per product visited by the customer."
- Add to basket Per Session: "The typical quantity of items a customer adds to their cart during a session."
- Product Detail See Per Application Session: "The typical number of products that users of the application view during a session."
- Credit Card Info Save: "Whether the customer has retained their credit card information in the system" (definite yes/no).
- Push Status (Yes/No Categorical): "Whether or not the customer accepts push notifications"
Churn: A binary variable that denotes whether a consumer is churning. A consumer who has chosen to discontinue using the product is known as a churn. It may be utilised as a target variable in e-commerce data for predictive models since foretelling if a consumer would discontinue using your product will assist you in avoiding this from happening.
Since the Python applications are misinterpreting the data type in columns 10, 15, 17, and 17 because they are intended to be numeric even though there are no missing data, we must change the comma to a dot (.) before converting these columns to float types.
Source Code Snippet
Output:
account_length                           int64
location_code                            int64
user_id                                  int64
credit_card_info_save                   object
push_status                             object
add_to_wishlist                          int64
desktop_sessions                         int64
app_sessions                             int64
desktop_transactions                     int64
total_product_detail_views               int64
session_duration                         int64
promotion_clicks                         int64
avg_order_value                        float64
sale_product_views                       int64
discount_rate_per_visited_products     float64
product_detail_view_per_app_session    float64
app_transactions                         int64
add_to_cart_per_session                float64
customer_service_calls                   int64
churn                                    int64
- - - - - - - - - - - - - - - - - - - - - - - - - - - - - - - - - - - -
dtype: object
Descriptive Statistic
The number features statistical descriptions. Using the.describe() function, we can examine the descriptive statistical information for the numerical data.
Source Code Snippet
Output:
| |
Acc length |
location code |
user id |
credit card info save |
push status |
add to wishlist |
desktop sess |
session duration |
Promo clicks |
sale view |
churn |
| 0 |
128 |
415 |
3824657 |
no |
Yes |
25 |
265 |
10 |
3 |
2,7 |
1 |
| 1 |
17 |
415 |
3717191 |
no |
Yes |
26 |
162 |
27 |
3 |
3,7 |
1 |
0 |
| 2 |
137 |
415 |
3581921 |
no |
No |
0 |
243 |
41 |
5 |
3,29 |
0 |
0 |
| 3 |
84 |
408 |
3759999 |
yes |
No |
0 |
299 |
51 |
7 |
1,78 |
2 |
0 |
| 4 |
75 |
415 |
3306626 |
yes |
No |
0 |
167 |
28 |
2.4 |
34.3 |
34 |
|
We draw the following conclusions from the descriptive statistics:
- The average time a client has held an account is 111 days, indicating that customers with registrations lasting more than 011 days may be outliers.
- Since consumers typically add things to their wish lists nine times, those who do so more often (01 or more times) may be considered outliers.
- Users are six times more inclined to utilise the computerised version of the shop than the mobile version, with an average of 191 desktop sessions compared to 31 mobile sessions. We also understand that some users are likely to utilise the desktop version, with some exceeding the typical user's usage by over two to one.
- Given that the data is categorised by user id and the required desktop transaction is zero, does this indicate that some consumers have never made a purchase? If that is the case, observing if these customers also tend to "Churn" more frequently will be fascinating.
- The typical Session lasts about 011 seconds, or about 0.5 minutes, with some possible outliers lasting longer than 035 seconds. By changing the length of the Session from seconds to minutes (375-011 = 173), we might theoretically cope with the session duration outliers, but if we are trying to develop a model, it could be simpler to prevent overfitting the feature because the scale is lower (7.17-0.5 = 3.57).
- It's interesting to note that while the minimum number of sales product viewing is 33, the minimum number of promotion clicks is 1. Even though the remainder of the data analysis is nearly identical, I would have anticipated a correlation between sales and promotions. I'm intrigued to learn more about it despite the minimums.
- The lowest average value of an order per client is £03, which is over eight times less than the median order value of £01 (I'm not sure regarding the currency, but since I'm based in the UK, let's go with GBP). This suggests that this client might be an anomaly, and it would be fascinating to determine whether or not they represent a "Churn."
- Since there are, on average, seven times fewer application sessions than desktop version sessions, the product detail perceives and purchases on the application are significantly fewer than the comparable features for the desktop version.
- A few shoppers never put anything in their basket, which is consistent with those who have never made a transaction.
- It will be fascinating to discover whether those consumers who have never contacted customer care have also never made a transaction. Could those customers be "Churn" if at least one called customer service nine times, more than five times the average?
- Average churn is low at 1.15, which is excellent for business, but with just 3,333 data, more is needed to draw any conclusions.
Non-Numeric Element Statistic, Description
With the code below, we can examine the descriptive data for features other than numeric ones:
Source Code Snippet
Output:
|
credit__card |
info__save push__status |
| count |
3333 |
3333 |
| unique |
0 |
0 |
| top |
no |
no |
| freq |
3111 |
0511 |
Non-Numeric Features
- We may view the total number of assessments, the total number of distinct values, the highest value, and the proportion of the most overall value for non-numeric attributes. We can infer the following from the screenshot above:
- The majority of users of the website need to save their credit card information. Could those who save credit card information exhibit trends with more sessions and average transactions? Does any of these individuals fit the Churn category?
- The vast majority of customers reject push notifications. Those that permit push notifications could exhibit trends with greater average transactions and session counts. Do any of the above users fit the Churn category?
Handling the Missing Values
The majority of real-world datasets can have problems with missing values. As we discovered when we utilised the.info() method, the Kaggle data is often of higher quality and has no missing values. Let's create some code below to do a secondary check and demonstrate how to determine whether the data set has any missing values.
Source Code Snippet
Visualise missing values
A heatmap is a visual application dealing with application reach to check for missing data. The visualisation may make it simpler to review if numerous variables with many values need to be added.
Source Code Snippet
Output:
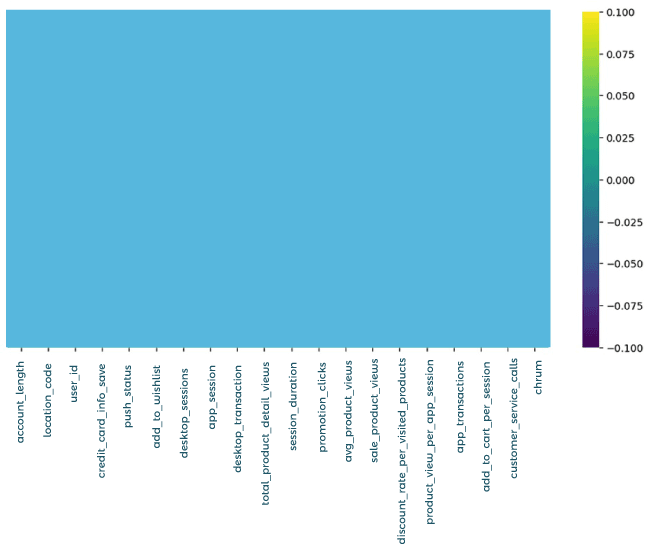
Heatmap of missing values
Checking for Duplicates
Duplicate records are another frequent problem with data. Always making sure to look for duplicates is important.
Source Code Snippet
As there are exactly as many unique user ids as observations in our data, the code's result of 3,333 indicates no duplicates.
Looking for anomalies
- It's crucial to keep an eye out for outliers while analysing data. These points of information are at the very edge of a dataset and may be a sign of inaccurate data or natural population changes.
- It's critical to ascertain if outliers are genuine or merely the product of imperfect data before cleaning your data. It is advisable to preserve the outliers in your data if they accurately reflect the natural variability in your sample. On the different hand, if mistakes cause outliers,
- We have already found a few possible anomalies in our examination of the data, including session lengths, average order values, promo clicks, offer product views, application operations, account lengths, wish list additions, desktop meetings, and customer support calls.
- We may employ a range of visualisations, including histograms and box plots, to further pinpoint outliers. Interquartiles can also be used to evaluate whether a data point is an outlier. According to the interquartile guidelines, a data point is regarded as an outlier if it is either lower than Q1-1.5(IQR) or higher than Q3 + 1.5(IQR).
- You may obtain more comprehensive insights into the information you collect and increase the certainty of your data-driven decisions by looking for and recognising outliers in your data.
You can find code to create customised interactive histograms and box plots using plotly express in the notebook that is linked to this article at the beginning. The code that generates histograms for each numerical variable in the dataset is shown below to save space in this post on the blog. Some significant outliers may be seen in the histogram charts; however, box plots make it simpler to find outliers.
Source Code Snippet
Output:
The result plots:
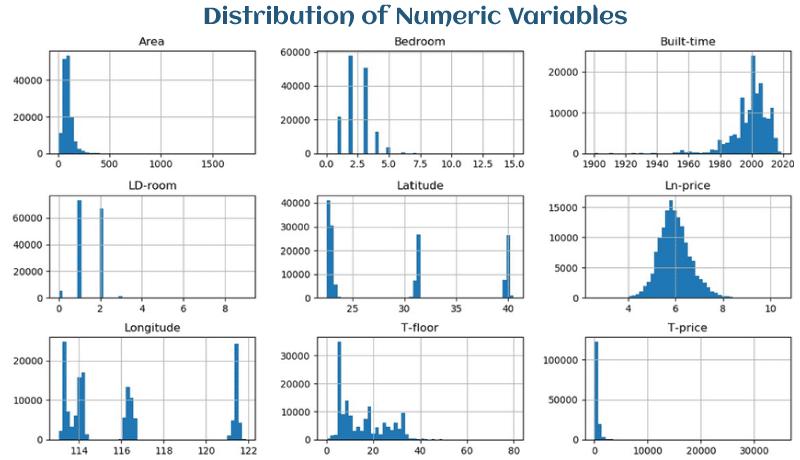
Figure: Distribution of numerical variables
We draw the following conclusions from the output:
The overall distribution of the numbers above reveals how customers behave while shopping online. Data
- Data is king in the e-commerce sector. Businesses may learn a lot about consumer behaviour and enhance their online presence by having the capacity to track and analyse every part of a customer's experience.
- We discovered in our research of e-commerce data that the outliers are probably just normal changes in the data sample. Therefore, we decided not to exclude them from our analysis. We were able to draw conclusions about client behaviour and make a few inquiries by examining the histograms:
- Most consumers do not add items to their wish lists, indicating they come to the website wanting to buy.
- Desktop users tend to have a greater number of visits and transactions.
- Most clients read product details, indicating that the business should concentrate on making these details thorough and enticing.
- The average customer stays on the website for about three minutes.
- Unlike users, application users typically view fewer product details and add two to four items to the cart per Session.
- Businesses may enhance their online presence and increase sales by studying these trends in client behaviour and using that knowledge to guide their actions. Sales can be increased by, among other things, providing product suggestions or grouping items.
An Analysis of Independent and Dependent Variables for Understanding Churn
In examining consumer behaviour, we have already covered a lot of territory by examining numerical factors like session lengths, average order values, and promotion clicks. The main goal of our study is to identify the behaviours or independent factors in our dataset that might aid in predicting customer turnover.
Which behaviours, in other words, can help us understand why customers choose to cease using the product? Now that we have shifted our attention, we will examine the link between the independent factors and the dependent variable, "churn."
The location code is a different variable that we still need to examine. We could find possible connections that could offer insightful conclusions by contrasting them with the turnover variable.
Plotting the churn
Let's plot the churn variable to observe its distribution relative to the not-churn. Plot using the code below. See a snapshot of the plot outcome below the code as well:
Source Code Snippet
Output:
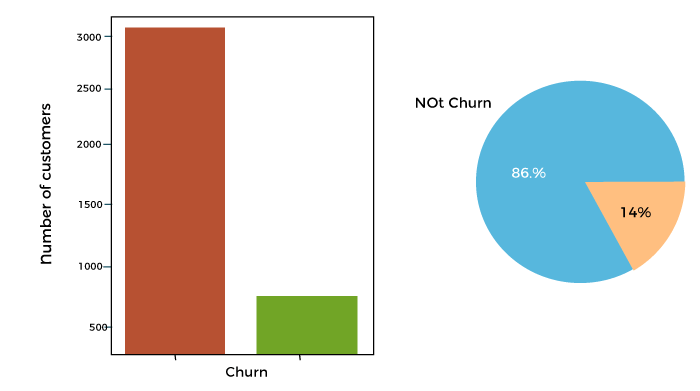
Figure: Plot Churn or Not Churn
Although it could be even lower than 15%, the fact that most customers do not churn is positive for the business.
Plot the categorical information.
In our dataset, there are three category variables:
- The location code contains three types.
- Push status; there are two types.
- Two kinds of stored credit card information
The three-category data are plotted in the code below:
Source Code Snippet
Output:
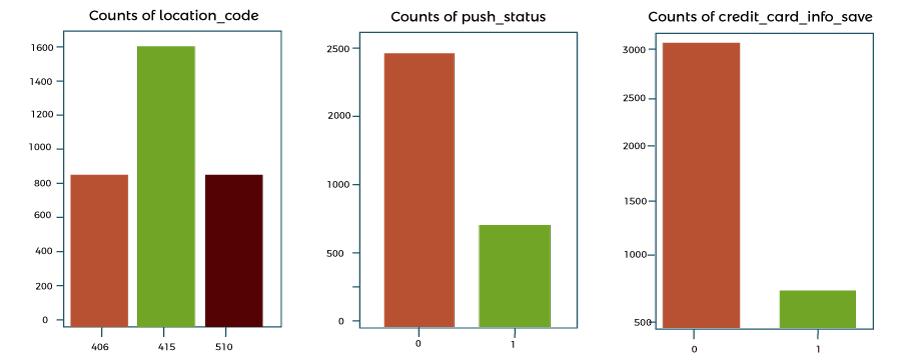
Figure: Plots of categorical variables
- Most users are in the area code 515, and the majority disapplicationrove of push notifications.
- The majority of customers don't keep their credit card details on hand
Against Categorical data, we Plot Churn
Plot Churn versus each data category by category using the code below.
Source Code Snippet
Consolidated Code for Analysis of Customer Behaviour using Python
Output:
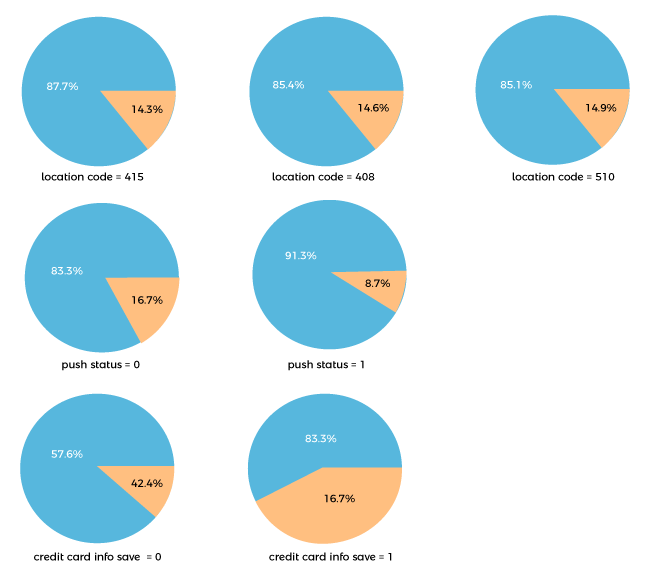
Figure: Churn vs each category of categorical data
We draw the following conclusions from the output:
The link between the categorical factors and the variable of interest, churn, has been examined in more detail. The following are some of the major findings from our analysis:
- Given that the percentage of clients that churn is consistent across locales, location code does not apply to be a reliable predictor of attrition.
- Customers who have activated push alerts are less likely to leave a company, indicating that urging them to do so may assist lower churn.
- It indicates that a customer's chance to stick with the company strongly correlates with whether or not they have saved their payment details on the website. Customers are far less likely to leave the site if they have saved their payment details on the website than if they have yet to. This connection is reasonable, given that saving.
- The website's content indicates brand credibility, likely increasing client loyalty.
The organisation may use this knowledge to reduce customer turnover by concentrating on certain client behaviours.
Conclusion
In conclusion, organisations may benefit greatly from utilising Python for consumer behaviour analysis. Businesses may learn about their customer's demographics, buying patterns, and other pertinent information by putting consumer behaviour data into a Pandas DataFrame and performing exploratory data analysis. Thanks to the sample we utilised, we got insights from descriptive statistics of data, like the average account length, wish list adds, desktop and application sessions, session duration, promotion click, and sales product views. Businesses may enhance their strategy and marketing initiatives by discovering outliers and correlations between attributes to serve their consumers better.
|

 For Videos Join Our Youtube Channel: Join Now


