Python Tutorial
Python OOPs
Python MySQL
Python MongoDB
Python SQLite
Python Questions
Plotly
Python Tkinter (GUI)
Python Web Blocker
Python MCQ
Related Tutorials
Python Programs
Scatter() plot pandas in PythonA data visualization method that displays the relationship between two numerical variables is called a scatter plot. In Python, there is a class named DataFrame that can be used to plot to scatter plots using pandas, and this class's member is called plot. By using the scatter() function on the plot component, a pandas DataFrame plot is drawn between two variables or two columns. Utilizing a Pandas DataFrame for a scatter plot
SyntaxHere, the syntax shows how to write code for the scatter() method: The following are the syntax parameters for the scatter() method:
ExamplesHere are various examples of scatter plots of pandas with different parameters. We can see the many scatter plots with a given size, color, and other functions. Example1: the following example shows a scatter plot using the pandas. We can see the plot values in the x and y-axis position with essential tuples. Output The following image shows a scatter plot of the pandas. 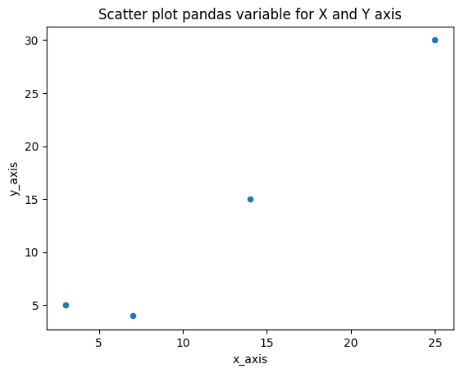
Example2: the following example shows a scatter plot using the pandas dataframe. Here, we use string and numerical values for scatter plots. Output The following image shows a scatter plot with value in Python. 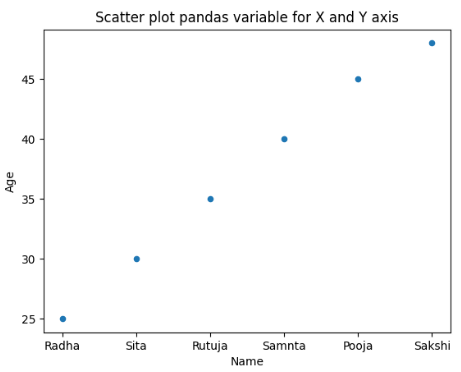
Example3: the following example shows a scatter plot using Python. Here, we use color to the tuple of the scatter plot. Output The following image shows a scatter plot with value in Python. 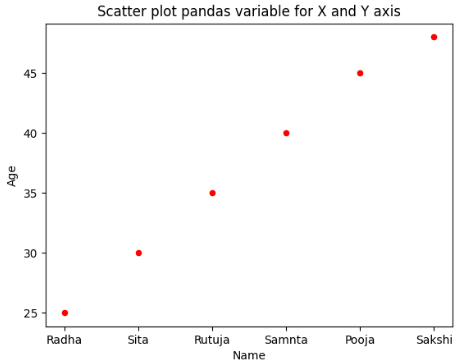
Example4: the following example shows a scatter plot using Python. Here, we use the required size of the tuple of the scatter plot. Output The following image shows a scatter plot with value in Python. 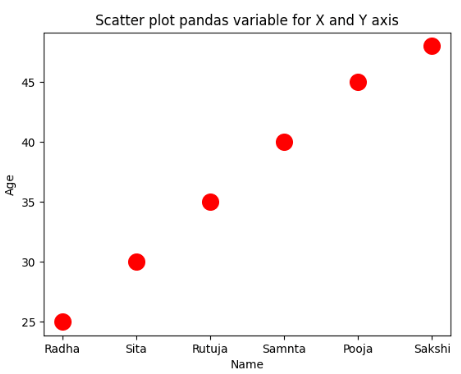
Example5: the following example shows a scatter plot using Python. Here, we use the required size of the tuple of the scatter plot with edge color. Output The following image shows a scatter plot with value in Python. 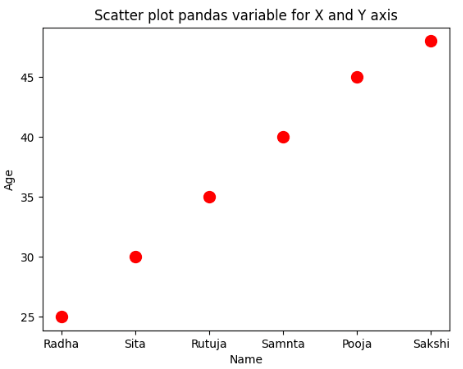
Example6: the following example shows a scatter plot using Python. Here, we use the required size of the tuple of the scatter plot with edge color and line width. Output The following image shows a scatter plot with value in Python. 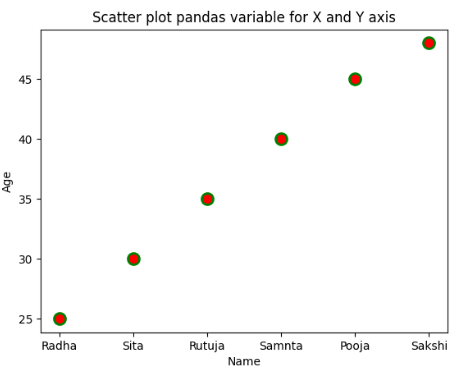
Example7: the following example shows a scatter plot using Python. Here, we use the required size of the tuple of the scatter plot with a different color. Output The following image shows a scatter plot with value in Python. 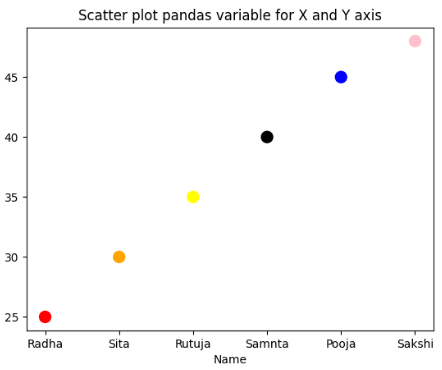
Example8: the following example shows a scatter plot using Python. Here, we use the required size of the tuple of the scatter plot with different colors and sizes Output The following image shows a scatter plot with value in Python. 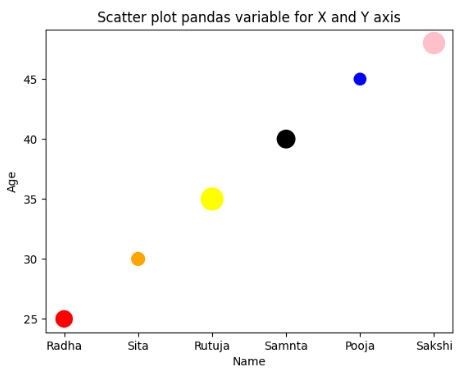
Example9: the following example shows a scatter plot using Python. Here, we use two bar-type scatter plots in different colors for comparison purposes. Output The following image shows a scatter plot with value in Python. 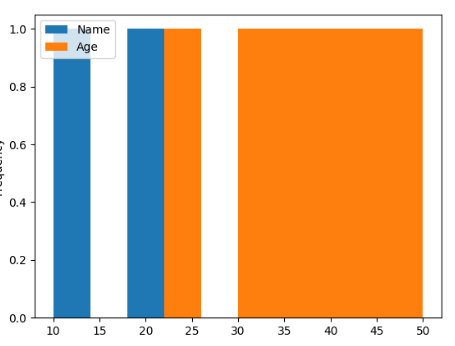
ConclusionThe scatter plot in pandas shows multiple types of graphs using python language. Here, we can create, display, and compare large-size data on a single page. It is a user-friendly, easy, simple, and sorted method to display data using scatter plots in Pandas.
Next TopicScatter() plot matplotlib in Python
|
 For Videos Join Our Youtube Channel: Join Now
Feedback
- Send your Feedback to [email protected]
Help Others, Please Share


