Python Tutorial
Python OOPs
Python MySQL
Python MongoDB
Python SQLite
Python Questions
Plotly
Python Tkinter (GUI)
Python Web Blocker
Python MCQ
Related Tutorials
Python Programs
COVID-19 Data Representation app using Tkinter in PythonThe globe is currently experiencing the coronavirus COVID-19 pandemic, which is not simply a pandemic but a serious global health issue. Coronavirus 2019 (COVID-19) is an infectious illness brought on by coronavirus 2 that causes severe acute respiratory syndrome (SARS-CoV-2). The 2019 coronavirus pandemic was caused by the illness, which was initially discovered in Wuhan, China, in 2019. Since then, it has spread around the world. Fever, coughing, and shortness of breath are common signs. Less frequently experienced include sore throat, sputum production, and muscle ache. We must thus stay informed on the overall number of confirmed cases, the number of recovered confirmed cases, the number of active cases, and the number of deaths attributable to the coronavirus. Through websites and news channels, we may acquire the latest. Some nations use mobile applications to access updates as well. These are all made feasible by information technology. Python offers the "COVID" package to obtain data on COVID cases globally as well as by nation. As a result, we will utilise Python libraries to gather data on the country- and global-level distribution of the coronavirus. This article focuses more on utilising Python and Tkinter to build effective web applications than it does on COVID-19. It makes it simple to use the technology on your own and is designed as a quick start guide. You may display the overall number of fatalities for a nation (this article uses India as an example) on a specific date as well as the total number of verified COVID-19 cases using Python and a few graphing packages. This article will aid in the interpretation and processing of data, which humans occasionally require assistance with. In this tutorial, we will go through how to use Tkinter Python to develop a COVID-19 Data Representation Application GUI and how to encode "COVID" related data to obtain visualised updates in graphical format. We must import a few libraries in order to create this interface; the list of libraries that we will require is shown below. json library : For retrieving the COVID-19 data. Tkinter library : Used for GUI development.
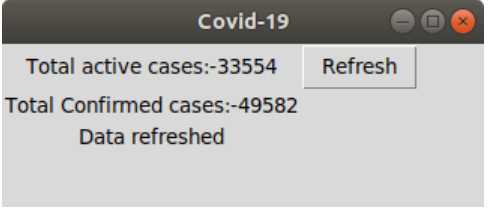
Canvas : Shapes may be drawn on your GUI using Canvas. Button widget : The buttons in the Tkinter are placed using the Button widget. Checkbutton : Create the check buttons for your application using the checkbutton tool. You should be aware that you can pick many options at once. Entry : To construct input fields in the GUI, utilise the Entry widget. Frame : In the Tkinter, frames are utilised as containers. Label : They are used to construct single-line widgets, such as text, photos, and other elements. Menu : In the GUI, menus are made using the menu command. Walking through the Code :To create the GUI that is necessary for our script, we first use the Tkinter Library. In order to obtain the data from the unofficial api, we are utilising requests Library. The information we want is then shown, total active cases and confirmed cases. So let us begin : We first imported the tkinter modules and along with it, we imported the json modules and the requests modules too, which will provide the data for the representation. Then, we created an instance of the tkinter module. Next, a new window was created. The title() method was used to give it a title and the geometry() method was used to specify the dimensions of the window. Next, we created new label in order to fill in some text that will be displayed on our window, using the label method. Labl was created for storing the value of the first label, which was the active number of cases and labl1 was created for storing the value of the second label, which was for confirmed number of cases. The labl2 was created to show a note after the data will be refreshed. And, using the grid() method, all these labels told their positions in the context of row and column. Then we created a new function called clicks(), which when called will give updated data at that particular moment. In this, we also used the variable link to provide the link of the external resource from where the data will be needed to be fetched. The variable pg was used to store the data attained by using the get() method, from the link mentioned before. Also, a variable called dt was also created in order to store the data in textual form that was attained from the json library using the loads() method. Then, using the configure method we provided the text that should be displayed by the labels labl, labl1 and labl2 on being called in the function clicks(). Then lastly, we used the button method to create the refresh button, which on clicking would refresh the data and provide the updated data. Ultimately, when the programme is prepared to launch, the mainloop() function is called. mainloop() is an endless loop that is used to launch the programme, watch for events, and handle them as long as the window is open. Complete code :Output: The screenshot of the output displayed by the aforementioned code is added below. 
Conclusion :Through this article, we got to know how to develop a Covid-19 Data Representation App using Tkinter in Python. This app is not only helpful to track the latest counts of the active number of cases and total number of confirmed cases, but is also a projection that how Python can be helpful to gather and arrange a certain type of data to help the humans.
Next TopicImage Viewer App Using Tkinter in Python
|
 For Videos Join Our Youtube Channel: Join Now
Feedback
- Send your Feedback to [email protected]
Help Others, Please Share


