| |

Student Academic Performance Prediction Using PythonUsing supervised linear regression (SLR) to train and assess machine learning models that predict students' academic achievement in the classroom. Introduction
The study of automatically learning algorithms via the use of data and experience is known as machine learning. It is a subset of computational intelligence predicated on the idea that a machine can make judgements with little to no human involvement by learning from data and recognizing underlying trends and patterns. Based on the intended objectives and the available data, it can be claimed that artificial intelligence (AI) is a technique for data analysis which allows the practitioner to assist management in making better decisions. Machine learning algorithms come in a variety of forms. The most popular classifications are Unsupervised, supervised, and Reinforcement learning. 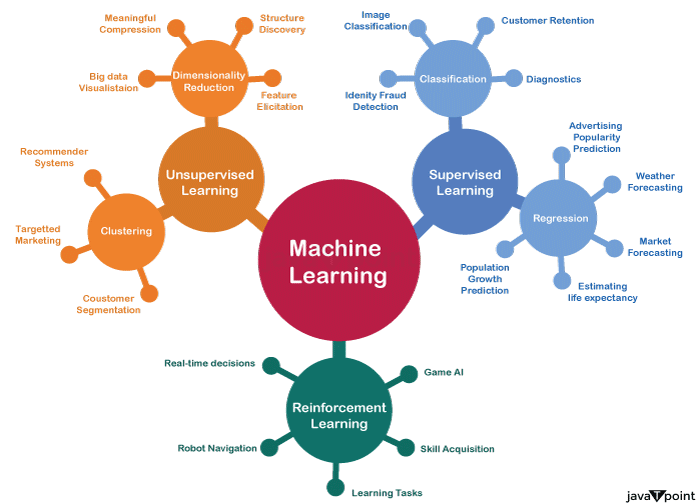
Types of algorithmic learning and the branching that they can take.
ApplicationA. Use Case GoalMachine learning-related research in the field of education has lately experienced rapid expansion. A new concept known as "Educational Data Mining" has emerged, which refers to the use of data mining methods in an educational setting to uncover unnoticed trends and patterns in student performance. This research attempts to create a machine learning-based prediction model for students' academic success. Any student's performance in a given topic may be determined using the model that emerged. The aim is to estimate a student's predicted grade depending on their study hours. B. Data DescriptionIn order to facilitate broad comprehension, the raw data was cleaned, adjusted, and given an attractive appearance. As seen above, there are two columns with 25 values each: Hours and Scores. The hypothesis developed is that there is, in fact, a positive association between our two factors after examining this dataset and helped by common perception. Let's continue and determine whether or not our hypothesis is true. C. Useful LibrariesPython modules are a collection of practical features that do all the work of writing new code for you. Currently, Python has around 137,000 libraries available. However, only Scikit-Learn, Pandas, NumPy, sklearn and Matpotlib will be used for this job.
Data scientists can use their expertise in data science and go through many stages with this project. Defining the business problem, gathering requirements, obtaining and using raw data from outside sources, cleaning and parsing the data, and analytical evaluation using machine learning technologies. Academic advisors, professors, and parents are just a few of the stakeholders that can use the assessment from the final analysis to reach a judgement. This project is open for debate and aimed at businesspeople and stakeholders because it has several factors to consider. A Prediction Model is Being BuiltAnalytical StrategySupervised Using machine learning will forecast and evaluate a student's grades. To start, we use a method known as the "simple linear regression model" to address the topic at hand. A line is widely employed in this statistical model to estimate the connection between two quantitative variables, one of which is the dependent variable and the other one or more of which is the independent variable. This approach is rapid and effective for small and medium-sized databases, and it might be helpful to conclude labelled data quickly. Our two quantitative factors are as follows:
Data Analysis1. Loading Data & Importing Libraries The relevant libraries will be imported. Scikit-Learn will be loaded later, so take note. Source Code Snippet: The provided data must now be loaded into the Interpreter for Python that I used on Jovian to continue with the model's training. Pandas is used for importing the CSV file and provides some validation when the data is imported successfully. In the same folder as this particular Interpreter, I had placed the file on my computer. Source Code Snippet: 2. Visualizing Data & Gaining Insights We will review a brief overview of the technical details of our data before moving forward. The info() method prints a succinct description of a particular DataFrame. This function gives details about a DataFrame, such as the following but not only:
Source Code Snippet: A sample that uses the info() method to display information about our DataFrame. We may restate that there are two columns, termed Hours and Scores, with 25 numbers in each column based on the information provided earlier. Therefore, the data provided to the algorithm for learning has 25 components. The hours' data (dtype) is of the float type, whereas the Scores' data (dtype) is of the integer variety. Both columns should include the same kind of data for future use. Briefly describe the data frame's metadata if both dtypes are the same. Source Code Snippet: Output: <class 'pandas.core.frame.DataFrame'> RangeIndex: 25 entries, 0 to 24 Data columns (total two columns): # Column Non-Null Count Dtype - - - - - - - - - - - - - - - - - - - - - - - - - - - 0 Hours 25 non-null float64 1 Scores 25 non-null float64 dtypes: float64(2) memory usage: 528.0 bytes A piece of code that previews the data. At the conclusion, an acknowledgment message is received. Note that by default, the head() method only displays a preview of the top five components. Add the number of components that must be visible between the parentheses to customize this. The data may be viewed using the head() method following a successful import and converting both columns' data types to the same one. Source Code Snippet: Output: 0 2.5 21.0 1 5.1 47.0 2 3.2 27.0 3 8.5 75.0 4 3.5 30.0 5 1.5 20.0 6 9.2 88.0 7 5.5 60.0 8 8.3 81.0 9 2.7 25.0 The first ten items of the dataset are displayed in a sample. A variety of abilities are necessary to become a data scientist. Three categories-technical skills, practical abilities, and soft skills-can be used to classify them. Possessing strong numerical abilities is one of the most important functional skills. It should be possible to interpret and analyze what the data are trying to tell you. A strong statistical foundation and space for interpretation are needed for this. Fortunately, a set of significant values for additional statistical analysis are provided by the describe() method. Output: Hours Scores count 25.000000 25.000000 mean 5.012000 51.480000 std 2.525094 25.286887 min 1.100000 17.000000 25% 2.700000 30.000000 50% 4.800000 47.000000 75% 7.400000 75.000000 max 9.200000 95.00000 A line of code displaying the dataset's statistics. 3. Plotting the Data The distribution scores must then be entered and plotted under the specification. To visualize the dataset and determine whether any relationships between the data can be found, the data points are shown on a 2-D graph. The following script is used to build the plot: Source Code Snippet: Output: 
A piece of code was used to plot a 2-D graph to find correlations in the dataset. It is clear from the graph above that the two variables have a positive linear connection, meaning that the number of study hours and the proportion of scores are directly related. 4. Get the data ready for the machine learning algorithm A flood of data is available in various forms, structures, and sources. Preparing this data for usage by end users by cleaning, organizing, and optimizing is a critical component of a data scientist's job. Business stakeholders, experts, and programmers are examples of end users. The findings are then interpreted using the "prepared" data, and information is relayed to management to help them make more educated decisions. Source Code Snippet: Output: Hours 0 Scores 0 dtype: int64 Source Code Snippet: Output: Hours Scores 0 2.5 21.0 1 5.1 47.0 2 3.2 27.0 3 8.5 75.0 4 3.5 30.0 After being certain that our dataset is null-free, the following step separates the data into characteristics (also known as inputs) and labels (also known as outputs). A piece of code that separates the data into attributes and labels. The next step is to divide this data into sets for training and testing after we have established our characteristics and labels. Scikit-Learn's built-in train_test_split() technique is used for this. It is time to train the algorithm when the data has been successfully divided into sets for testing and training. A straightforward linear regression model must be utilized, as was already described. C. Using a machine learning algorithm to train a portion of code demonstrates how our algorithm was trained. At the conclusion, a confirmation message is received. We shall draw the regression line now that the training is complete. A portion of the 2-D graph demonstrates the two variables' positive association. The line of regression on the 2-D graph shows a positive association between our two variables. This strengthens the validity of our earlier theory, which is now broadly acknowledged. D. Prediction-Making It is now time to make predictions using the trained version of our system. A sample of the forecasts that our ML model generated. An example of how our ML model compared the actual results to the projected scores. Our machine learning model's findings indicate that our two factors are directly related. Predicted scores exhibit some overestimation and underestimate. E. Using Custom Data for Testing a section of code that uses a random integer to make a prediction. As can be seen, the expected score is 93.692 compared to 100 (rounded to the second decimal point) over 9.25 hours. F. Assessing a Machine Learning Algorithm Evaluation of our algorithm's performance is the final phase. This last stage is crucial for evaluating various algorithms' performance on a given dataset. Numerous metrics can be applied. But we'll make use of the mean error of squares. Results & Discussion
Consolidated code of Student Academic Performance Prediction Using PythonOutput: <class 'pandas.core.frame.DataFrame'> RangeIndex: 25 entries, 0 to 24 Data columns (total two columns): # Column Non-Null Count Dtype - - - - - - - - - - - - - - - - - - - - - - - - - - - - - - - - - - - - - - - - - - - - - - - 0 Hours 25 non-null float64 1 Score 25 non-null float64 dtypes: float64(2) memory usage: 528.0 bytes Input: Output: <class 'pandas.core.frame.DataFrame'> RangeIndex: 25 entries, 0 to 24 Data columns (total 2 columns): # Column Non-Null Count Dtype - - - - - - - - - - - - - - - - - - - - - - - - - - - - - - - - - - - - - - - - - - - - - - - 0 Hours 25 non-null float64 1 Score 25 non-null float64 dtypes: float64(2) memory usage: 528.0 bytes Input: Output: Hours Scores 0 2.5 21.0 1 5.1 47.0 2 3.2 27.0 3 8.5 75.0 4 3.5 30.0 Input: Output: Hours Scores 0 2.5 21.0 1 5.1 47.0 2 3.2 27.0 3 8.5 75.0 4 3.5 30.0 5 1.5 20.0 6 9.2 88.0 7 5.5 60.0 8 8.3 81.0 9 2.7 25.0 Being a Data Scientist requires having a couple of functional skills, such as having a good sense of numbers. One should be able to analyze and translate what the numbers are saying. This requires a firm hold on statistics. Thankfully, the describe() function provides a set of important values for further statistical analysis. Input: Output: Hours Scores count 25.000000 25.000000 mean 5.012000 51.480000 std 2.525094 25.286887 min 1.100000 17.000000 25% 2.700000 30.000000 50% 4.800000 47.000000 75% 7.400000 75.000000 max 9.200000 95.000000 Input: 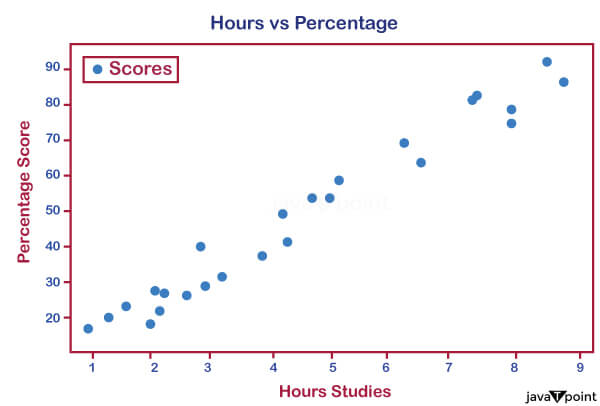
Input: Output: Hours 0 Scores 0 dtype: int64 Input: Output: <class 'pandas.core.frame.DataFrame'> RangeIndex: 25 entries, 0 to 24 Data columns (total 2 columns): # Column Non-Null Count Dtype - - - - - - - - - - - - - - - - - - - - - - - - - - - - - - - - - - - - - 0 Hours 25 non-null float64 1 Score 25 non-null float64 dtypes: float64(2) memory usage: 528.0 bytes Input: Output: Hours Scores 0 2.5 21.0 1 5.1 47.0 2 3.2 27.0 3 8.5 75.0 4 3.5 30.0 Input: Output: Algorithm's training has been completed. Input: 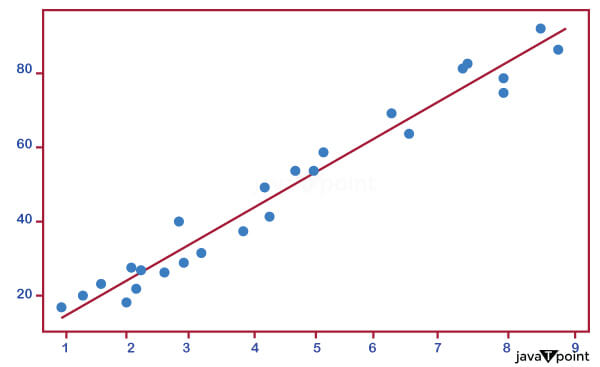
Input: Output: [3.2] [7.4] [2.5] [5.9]] [[1.5] [3.2] [7.4] [2.5] [5.9]] Input: Output: Actual Scores Predicted Scores 0 20.0 16.88414 1 27.0 33.73226 2 69.0 75.35701 3 30.0 26.79480 4 62.0 60.49103 Input: Output: Hours Actual Scores Predicted Scores 0 1.5 20.0 16.88414 1 3.2 27.0 33.73226 2 7.4 69.0 75.35701 3 2.5 30.0 26.79480 4 5.9 62.0 60.49103 Input: Output: Mean Absolute Error: 4.18385989902982 ConclusionDue to several variables, choosing and devoting the finest practise and atmosphere to improve a student's academic portfolio can be difficult and an uphill struggle. But in today and age, with so much human activity taking place online, the abundance of data and advanced algorithms for machine learning have made it simpler for us to understand a topic of our choice and the related entities. This enables stakeholders, company owners, and entrepreneurs to all make reasoned decisions supported by data and research. |
 For Videos Join Our Youtube Channel: Join Now
Feedback
- Send your Feedback to [email protected]
Help Others, Please Share


