| |
Python Tutorial
Python OOPs
Python MySQL
Python MongoDB
Python SQLite
Python Questions
Plotly
Python Tkinter (GUI)
Python Web Blocker
Python MCQ
Related Tutorials
Python Programs

How to Make an Area Plot in Python using BokehBokeh is an Interactive Data visualization library of Python. It creates its plots by using HTML and JavaScript languages. Its basic targets are modern website browsers for presenting provided elegance, concise construction of novel graphics with high-performance interactivity. In this tutorial, we will learn how to create an area plot on a graph using the bokeh library. Plotting the Area PlotsArea Plots can be defined as the filled regions between two series that share a common area. The Bokeh figure class has two functions, namely:
1. varea() Function:The varea() function is used for vertically directed areas. It has one "X" coordinate array and two "Y" coordinate arrays, "Y1" and "Y2", which would be filled between. Syntax: Syntax for varea() function is: Parameter: The varea() function accepts the following parameters:
Code: Output: 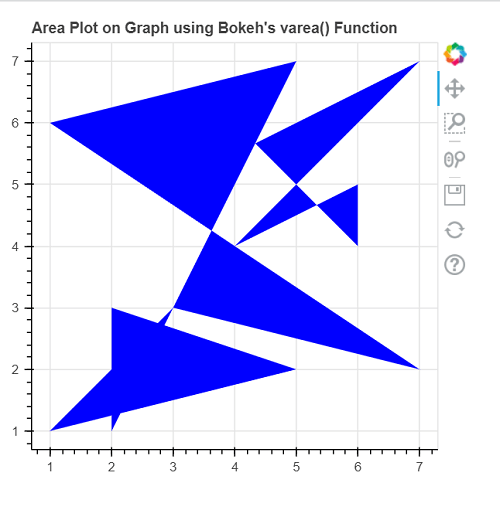
2. harea() Function:The harea() function of the Bokeh library is used for horizontally directed areas on a Graph. It has one "Y" coordinate array and two "X" coordinate arrays, "X1" and "X2", which would be filled between. Syntax: Syntax for harea() function is: Parameter: The harea() function accepts the following parameters:
Code: Output: 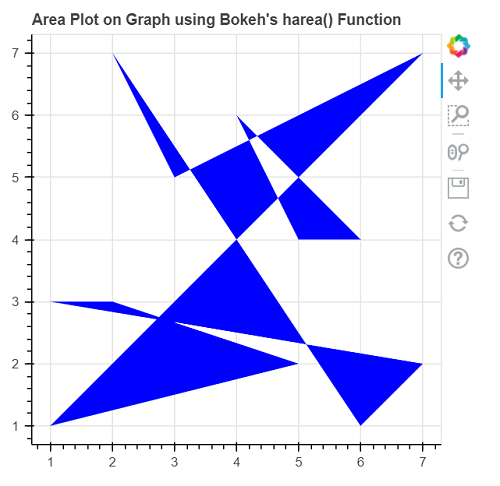
ConclusionIn this tutorial, we discussed how we could create area plots in vertical and horizontal directions using the varea() and harea() function of the bokeh library in Python.
Next TopicPython ChemPy Module
|
 For Videos Join Our Youtube Channel: Join Now
Feedback
- Send your Feedback to [email protected]
Help Others, Please Share


