| |
Python Tutorial
Python OOPs
Python MySQL
Python MongoDB
Python SQLite
Python Questions
Plotly
Python Tkinter (GUI)
Python Web Blocker
Python MCQ
Related Tutorials
Python Programs

Python Xticks in PythonMatplotlibMatplotlib is a Python library that extends the NumPy library with numerical and mathematical functions. Pyplot is a state-based interface to a MATLAB-like Matplotlib module. Ticks are data point symbols that appear on axes. Matplotlib's default tick locators and formatters are intended to be useful in a wide range of circumstances. Tick placements and labels can be explicitly specified to fit specific requirements. A list object is passed as an argument to the xticks() and yticks() functions. The list components represent the points on the appropriate action where ticks will be displayed. matplotlib.pyplot.xticks() FunctionTo acquire and set the current tick locations and labels of the x-axis, use the annotate() method of the matplotlib library's pyplot module. Syntax: The Parameters Used:
Return Type: The xticks() function in Matplotlib returns:
ExamplesShow How to use the matplotlib.pyplot.xticks() Function in matplotlib.pyplot: Example 1: Using matplotlib.pyplot.xticks. Code: Output: 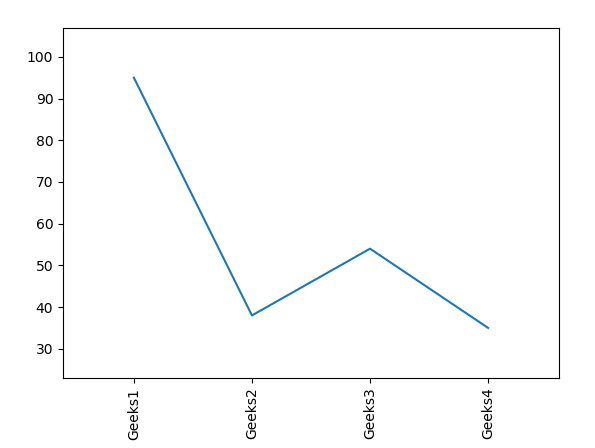
Example 2: Code: Output: 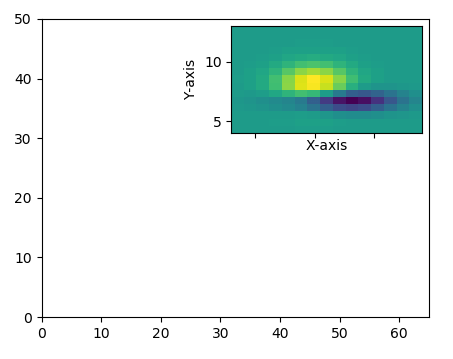
Conclusion
|
 For Videos Join Our Youtube Channel: Join Now
Feedback
- Send your Feedback to [email protected]
Help Others, Please Share


