| |
Python Tutorial
Python OOPs
Python MySQL
Python MongoDB
Python SQLite
Python Questions
Plotly
Python Tkinter (GUI)
Python Web Blocker
Python MCQ
Related Tutorials
Python Programs

How to Plot a Pie Chart using Bokeh Library in PythonBokeh is a Python library which is used for data visualization. It creates its plots using HTML and JavaScript languages, and it also targets modern website browsers to provide presentation elegant, concise construction of novel graphics good high-performance interactivity. In this tutorial, we will learn how to plot a pie chart by using the Bokeh library in Python. Although the bokeh library does not provide any module for directly plotting a pie chart, users can use wedge glyphs to create the pie chart. The wedge () function has the following primary parameters:
To plot wedges in such a way that the output looks like a pie chart. However, the x and y coordinates of the wedge and the radius parameters, the user has to adjust the start_angle and end_angle parameters. Example 1:Output: 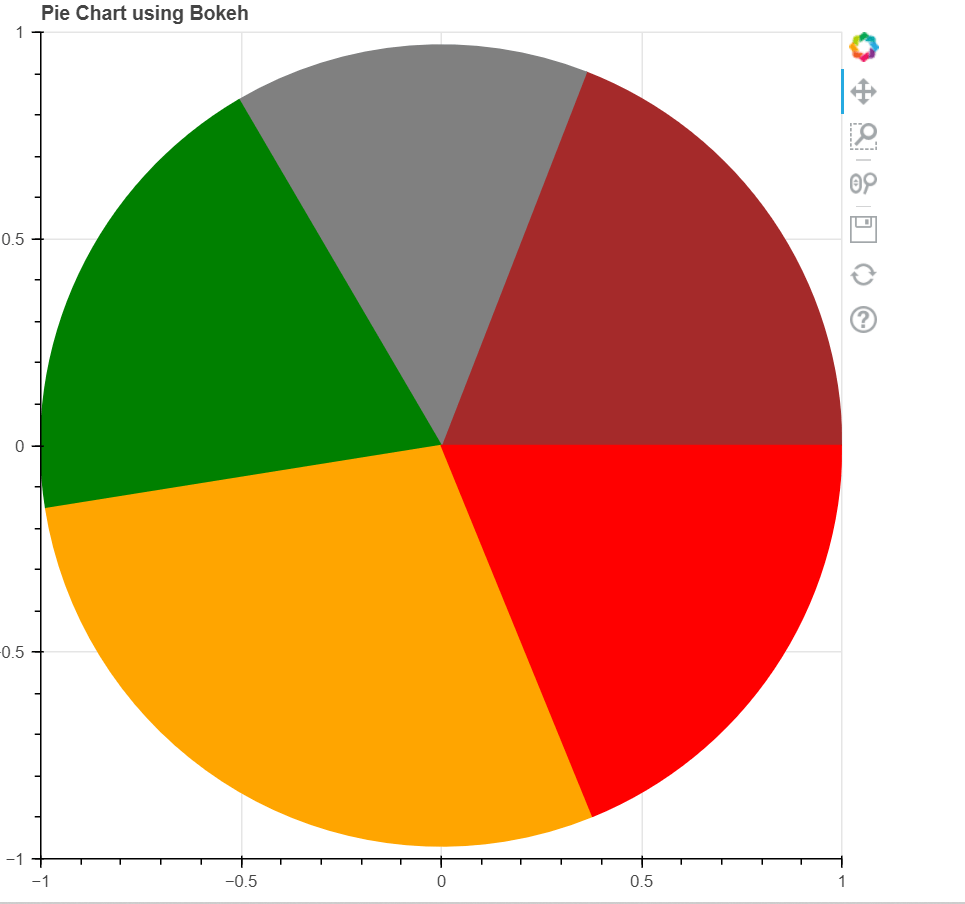
Example 2:In this example, the user will visualize some data. The data contains the detail of the field in which a company invested in 2014 - 15. The fields are:
The user can convert the percentage into radian for finding the value of start_angle and end_angle by using the following formula: Code: Output: 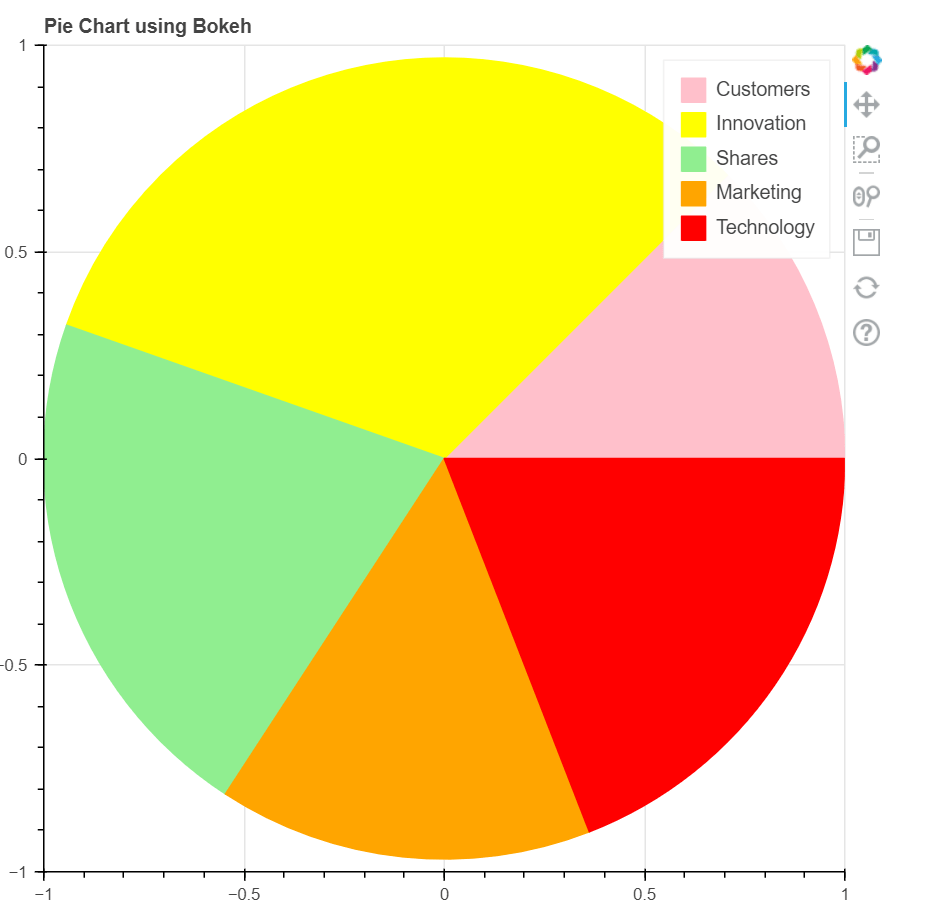
ConclusionIn this tutorial, we have discussed how we can plot a pie chart for the visualization of data by using the bokeh library in Python. |
 For Videos Join Our Youtube Channel: Join Now
Feedback
- Send your Feedback to [email protected]
Help Others, Please Share


