| |
Python Tutorial
Python OOPs
Python MySQL
Python MongoDB
Python SQLite
Python Questions
Plotly
Python Tkinter (GUI)
Python Web Blocker
Python MCQ
Related Tutorials
Python Programs

How to change the size of figure drawn with matplotlib?In this tutorial, we will discuss how to adjust the size of figures created with matplotlib in Python. Matplotlib library is widely used for creating graphs. IntroductionMatplotlib is popular for creating figures for representing data. We can populate the figure with all different types of data, including axes, a graph plot, a geometric shape, etc. We can perform various operations on a matplotlib generated graph where adjusting the sizing is a common task. Sometimes, we require setting the size of the figure to a specific size. The graph can be wider in size, taller in height, etc. The matplotlib. figure() provides the figsize attribute that specifies the width and height of a figure in-unit inches. Let's understand the following syntax. Syntax: The figsize is an optional parameter of figure() method. By default, the figure has the dimensions as (6.4, 4.8). Generally, each unit inch is 80 x 80 pixels. However, we can change the pixel per unit inch using the dpi parameter, which can be specified in the same function. We will follow the below approach.
Let's understand the following example. Example - Output: 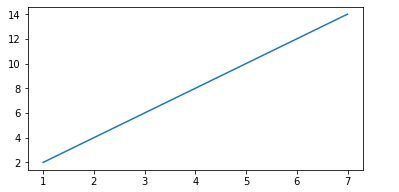
Example - 2: Output: 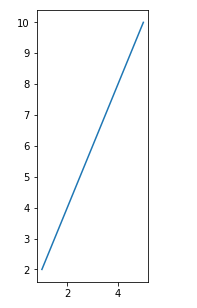
In the above code, we have increased the height as compare to width and changed the graph plot. We can also set the size of the subplots using the same method. Let's understand the following example. Example - Output: 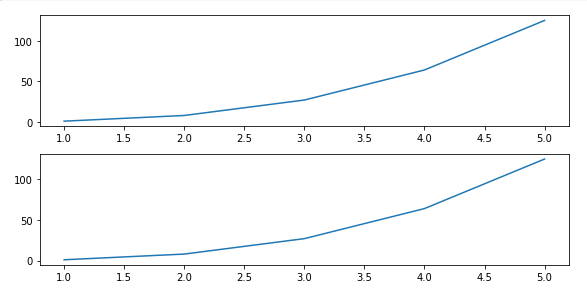
Set the Height and Width of a Figure in MatplotlibWe can also set the figure's height and width without using the figsize argument. It can be done using the set() function with the figheight and figwidth arguments. The set_figheight() and set_figwidth() functions are also used to set height and width. Let's understand the following example. Example - Output: 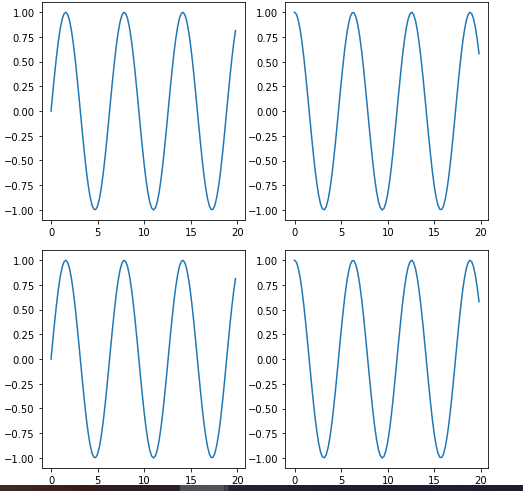
On the other hand, we can also use the set_size_inches(). Below is the example. Example - 2: Output: 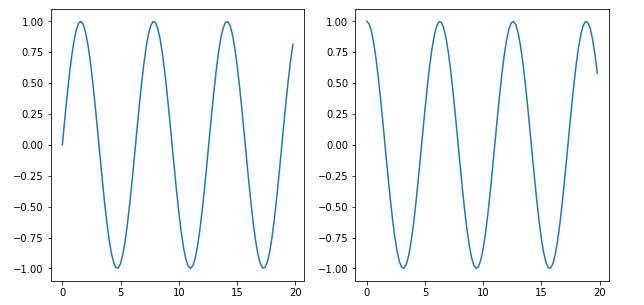
Modifying the GraphIt is another way to modify the graph attributing without using the figure environment. We can also update matplotlib.rcParams, an instance of RcParams for handling default matplotlib values. Let's understand the following example. Example - Output: 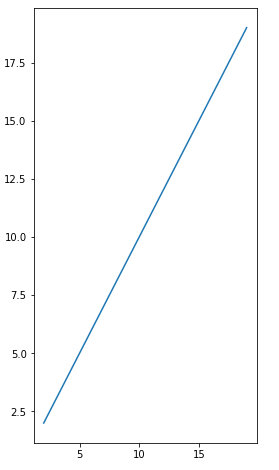
ConclusionWe have discussed several ways to change the size of a figure in matplotlib. These figures are very useful for data visualization. You can use any option that suit your requirement.
Next TopicKeyboard Module in Python
|
 For Videos Join Our Youtube Channel: Join Now
Feedback
- Send your Feedback to [email protected]
Help Others, Please Share


