| |

Social Progress Index Analysis Project in PythonAn indicator of social advancement around the world is the Social Progress Index (SPI). It aids in comprehending how much concern other nations have for the general welfare of their population. This tutorial is for you if you want to examine the social progress index. This post will walk you through a Python-based Social Progress Index analysis. Three dimensions are combined in the index:
This framework encompasses various interconnected elements that the academic research and practitioner experience have identified as supporting social advancement. Four components per dimension, each comprising three to five distinct outcome indicators. The indicators chosen for inclusion are accurately measured across all (or nearly all) of the sample countries by the same organization using a standardized technique. The Social Progress Index's two main characteristics are:
When creating the Social Progress Index, Social Progress Imperative considered hundreds of potential indicators, consulting with MIT experts to identify the metrics that best distinguished between countries' performances. The index employs outcome measures when there are enough data or the most accurate proxies. Social Progress Index AnalysisThe total level of development of a nation's inhabitants is considered while calculating the Social Progress Index score. The following are all the variables taken into account while determining the Social Progress Score:
Thus, these are the main variables when determining a country's SPI score. On Kaggle, I discovered a dataset with all these elements. Analyzing the Social Progress Index will be useful. You can go website Kaagle.com and download the dataset Before continuing, I want to ensure you know that Tableau is the best option if you want to construct an advanced data science project on the Social Progress Index Analysis because such datasets can be better visualized and studied on dashboards. In the section below, you can learn how to use Python to analyze the social progress index. About DatasetThe Social Progress Index (SPI) gauges how well nations meet the requirements of their population in the social and environmental spheres. The relative performance of countries is shown through 55 indicators in the categories of fundamental human needs, pillars of well-being, and chance for advancement. Instead of focusing on economic variables, the SPI directly observes social and environmental consequences to determine a society's level of well-being. Wellness (including health, housing, and sanitation), inclusion, sustainability, equality, and personal freedom and safety, are among the social and ecological elements. COLUMN DESCRIPTION
FILE NAME:spi.csv Social Progress Index Analysis using PythonLet's begin by importing the dataset and the relevant Python libraries: Output: spi__rank country spi__score basic__human__needs wellbeing \ 0 1.0 Norway 92.63 95.29 93.30 1 2.0 Finland 92.26 95.62 93.09 2 3.0 Denmark 92.15 95.30 92.74 3 4.0 Iceland 91.78 96.66 93.65 4 5.0 Switzerland 91.78 95.25 93.80 opportunity basic_nutri_med_care_ water_sanitation_ shelter \ 0 89.30 98.81 98.33 93.75 1 88.07 98.99 99.26 96.48 2 88.41 98.62 98.21 94.92 3 85.04 98.99 98.82 93.16 4 86.28 98.72 98.96 92.97 personal_safety_ access_basic_knowledge_ access_info_comm_ health_wellness_ \ 0 90.29 98.66 95.80 89.32 1 87.75 96.32 95.14 85.73 2 89.46 97.44 98.18 85.15 3 95.66 99.51 93.12 91.02 4 90.35 98.60 95.07 91.50 env_quality_ personal_rights_ personal_freedom_choice_ inclusiveness \ 0 89.44 96.34 91.16 83.77 1 95.15 96.13 88.10 82.81 2 90.20 97.08 90.03 81.64 3 90.93 95.14 88.01 77.63 4 90.05 96.69 90.65 74.81 access_adv_edu_ 0 85.92 1 85.23 2 84.89 3 79.39 4 82.99 Al the important factors like Essential human needs, Wellbeing, Opportunities, Food and fundamental medical care, Water and hygiene, Protection, Personal Security, Access to knowledge that is fundamental, Access to information and communication, Fitness and health, Environmental protection, Individual rights, Individual discretion and decision, Diversity, Access to higher education, etc, are coved in the columns of this dataset. Query: Output:
spi__rank                   country  spi__score  basic__human__needs  \
164     165.0                   Eritrea      35.33              44.94
165     166.0                      Chad      34.60              35.65
166     167.0  Central African Republic      33.53              29.91
167     168.0               South Sudan      32.50              39.96
168       NaN                     World      65.05              74.18

     wellbeing  opportunity  basic_nutri_med_care_  water_sanitation_  shelter  \
164      35.95        25.10                 57.92             27.91    50.27
165      36.26        31.87                 47.24             21.48    33.00
166      34.83        35.84                 36.42             26.95    26.79
167      34.17        23.37                 59.29             24.43    33.28
168      64.42        56.54                 84.92             69.99    80.63

     personal_safety_  access_basic_knowledge_  access_info_comm_  \
164            43.67                   40.18              6.81
165            40.90                   23.14             24.31
166            29.46                   34.81             22.57
167            42.84                   27.18              9.16
168            61.20                   72.03             70.22

     health_wellness_  env_quality_  personal_rights_  personal_freedom_choice_  \
164            41.68        55.12            14.88                    37.86
165            41.47        56.13            52.04                    28.66
166            24.60        57.35            52.39                    26.67
167            37.14        63.22            27.40                    32.50
168            60.18        55.27            60.16                    62.22
     inclusiveness  access_adv_edu_
164          24.82           22.84
165          22.03           24.76
166          37.87           26.43
167          13.42           20.17
168          42.22           61.58
Showing Basics StatisticsIt's time to gain an overview of the values that each column in your dataset includes now that you've seen what data types are present. This is possible with. describe(). The describe() method of the Pandas DataFrame is used to compute some statistical data, such as percentile, mean, and standard deviation of various quantitative data of the DataFrame. It is used to examine numeric data, object series, and DataFrames with mixed-type column sets. The describe() method of a Pandas DataFrame provides all the necessary details about the data, which can then be used to analyze the data and generate further mathematical hypotheses for research. The Pandas library's statistics section is handled by the DataFrame describe() function. By default, the describe() method only examines numeric columns, but if you use the include parameter, you can supply other data types. Output:
spi__rank   spi__score  basic__human__needs   wellbeing  opportunity  \
count  168.000000  169.000000         169.000000  169.000000   169.000000
mean    84.500000   67.433136          76.142959   67.774379    58.381657
std     48.641546   15.012150          16.252248   15.397385    15.805868
min      1.000000   32.500000          29.910000   34.170000    23.370000
25%     42.750000   55.170000          62.650000   55.480000    47.900000
50%     84.500000   68.090000          82.460000   67.350000    56.440000
75%    126.250000   78.810000          88.700000   79.200000    69.480000
max    168.000000   92.630000          96.850000   93.800000    89.300000
       basic_nutri_med_care_  water_sanitation_     shelter  personal_safety_  \
count            169.000000        169.000000  169.000000       169.000000
mean              84.705976         76.122840   77.088166        66.656509
std               14.414040         23.408526   18.811647        14.404784
min               36.420000         14.800000   26.790000        29.460000
25%               72.420000         57.060000   64.570000        55.810000
50%               91.330000         86.150000   87.300000        67.210000
75%               96.720000         96.750000   90.620000        76.340000
max               98.990000         99.270000   96.870000        96.180000
       access_basic_knowledge_  access_info_comm_  health_wellness_  env_quality_  \
count              169.000000        169.000000       169.000000   169.000000
mean                74.758698         66.822367        62.325562    67.189704
std                 19.464110         20.382707        16.034389    14.340080
min                 23.140000          6.810000        21.030000    23.950000
25%                 61.560000         52.110000        49.530000    58.290000
50%                 79.080000         70.280000        62.370000    67.280000
75%                 91.220000         82.750000        73.330000    77.540000
max                 99.510000         98.180000        92.100000    95.150000
       personal_rights_  personal_freedom_choice_  inclusiveness  access_adv_edu_
count       169.000000               169.000000     169.000000      169.000000
mean         69.627811                62.908343      46.802840       54.188166
std          21.535655                15.078164      17.008499       18.564111
min          14.880000                26.670000       4.260000       19.700000
25%          54.010000                52.670000      34.300000       36.230000
50%          71.200000                62.420000      47.240000       54.320000
75%          88.660000                73.790000      58.150000       68.470000
max          97.910000                91.160000      83.770000       89.600000
According to the SPI ranking, Norway leads the world in the Social Process Index. Before continuing, let's have a look at the column insights: Output: 1 So that we can classify scores as high and low, let's now examine the highest, average, and lowest SPI scores: Output: Highest Score of SPI : 92.63 Lowest Score of SPI : 32.5 Average Score of SPI: 67.43313609467457 We can define 85 as the minimum need for a high SPI score because 92 is the highest, and 67 is the average SPI score. Let's examine some information regarding the nations with high SPI scores. Let's start by examining the nations that have superior access to facilities for fundamental human needs: Output: 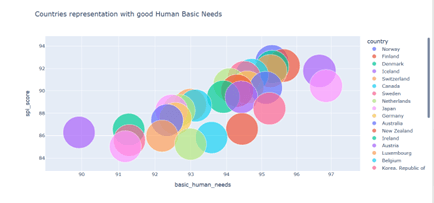
The two nations with the best infrastructure for meeting fundamental human requirements are Iceland and the Japanese. Let's now examine the nations that offer more opportunities: Output: 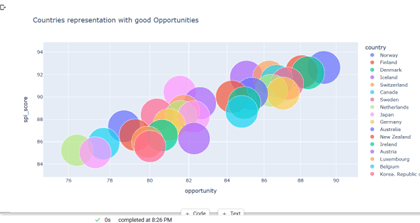
There are more opportunities in the top 3 nations: Denmark, Norway, and Finland. Let's now examine the nations with the best food and medical facilities: Output: 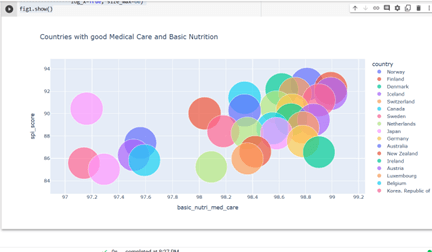
The top 3 nations with the best access to healthcare and nutrition are Iceland, Finland, and Norway. Let's now examine the nations with greater water sanitation: Output: 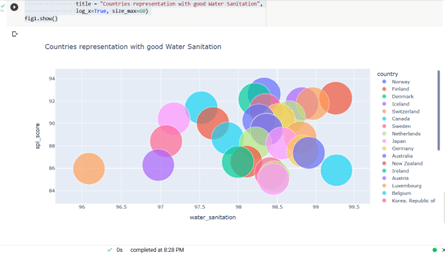
The two nations with the best water sanitation practices are Switzerland and Finland. So, using this method, we can examine every element used to determine the SPI score. Let's now make a choropleth map representation to examine the worldwide Social Progress Index scores as a whole: Here we are setting dictionary values with locations, location mode, and text to be displayed on the console. Also, we are setting the projection type to 'azimuthal equal area'. At last, we will plot the figure using the iplot() function. Consolidated Code:Output: 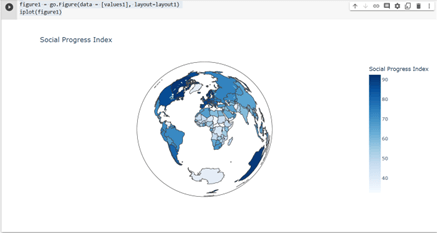
Thus, this is how the Python computer language can be used to examine the Social Progress Index. SummaryI hope you enjoyed reading this post about Python's Social Progress Index Analysis. An indicator of social advancement around the world is the Social Progress Index (SPI). It aids in comprehending how much concern other nations have for the general welfare of their population.
Next TopicAdvance Bar Graph in Python
|
 For Videos Join Our Youtube Channel: Join Now
Feedback
- Send your Feedback to [email protected]
Help Others, Please Share


