| |
Python Tutorial
Python OOPs
Python MySQL
Python MongoDB
Python SQLite
Python Questions
Plotly
Python Tkinter (GUI)
Python Web Blocker
Python MCQ
Related Tutorials
Python Programs

How to Plot Multiple Linear Regression in PythonA strategy of modeling the relationship between a dependent feature (the target variable) and a single independent feature (simple regression) or multiple independent features (multiple regression) is called linear regression. The linear regression algorithm works on the assumption that both types of variables have a linear relationship. If this relationship exists, we can calculate the model's necessary coefficients to make forecasts based on new or unseen data. Descriptive Analysis of VariablesIt's usually a good idea to plot visualization charts of the data to comprehend it better and check if there are relationships between each feature before stepping further into applying multi-linear regression. We'll utilize the pairplot() method from the Seaborn package to plot the relationships between the features. The function will produce a figure with a histogram and a scatter plot connecting each feature. Using a variety of libraries, including Numpy, Pandas, Scikit-Learn, and Scipy, we will learn how to apply and visualize the linear regression process in Python from scratch in this tutorial. Importing The LibrariesWe will import some of the Python libraries we need, such as NumPy, Pandas, sklearn, matplotlib, etc., in our first step. Additionally, we'll use the Pandas library to load the dataset from the GitHub repositories and convert the dataset into a dataframe called df. Code Output:
(545, 4)
      price  area  bedrooms  stories
0  13300000  7420         4        3
1  12250000  8960         4        4
2  12250000  9960         3        2
3  12215000  7500         4        2
4  11410000  7420         4        2
Feature SelectionWe will see the relationships between the features using a pair plot. Code Output: 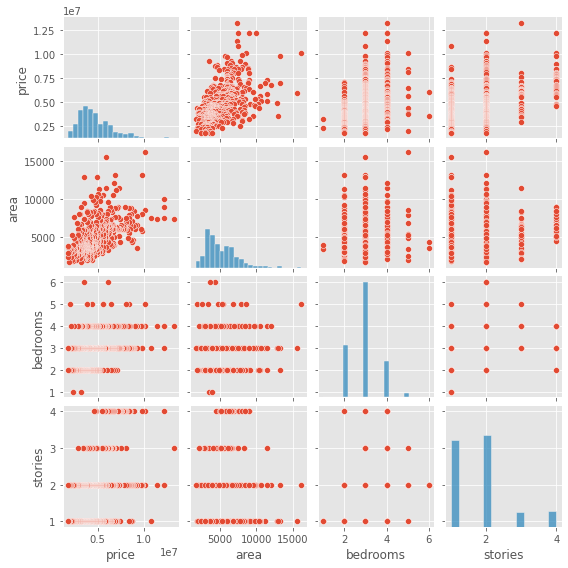
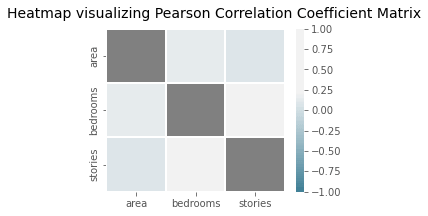
We can see in the first row of the figure that there is a linear relationship between price and area features of the dataset. We can see that the scatter plots of the rest of the variables are random and show no relationship among them. We should take only one of the multiple independent features having a relationship between them. While here, prices are the target variable, so there is no need to drop and feature. MulticollinearityThe multiple linear regression model assumes no correlation exists between the predictors or the independent variables employed in the regression. Using the corr() method from the Pandas dataframe, we can compute the Pearson correlation coefficient value between every two features of our data and build a matrix to see whether there is any correlation between any predictors. After that, we can use Seaborn's heatmap() plot to display the matrix as a heatmap. Code Output:
Pearson correlation coefficient matrix for each independent variable:
               area  bedrooms   stories
area      1.000000  0.151858  0.083996
bedrooms  0.151858  1.000000  0.408564
stories   0.083996  0.408564  1.000000
Building a Multiple Linear Regression ModelLet's move forward toward developing our regression model. Now that we have already seen no relationship and collinearity between the features, we can use all the features to build the model. We'll use the LinearRegression() class of Sklearn's linear_model library to create our models. Code Output: Intercept: 157155.2578429943 Coefficients array: [4.17726303e+02 4.18703502e+05 6.73797188e+05] We will attempt to convert our model into a three-dimensional graph using the code cell below. Our data point will be shown on the chart as grey dots, and the linear model will be represented as the blue plane. Code Output: 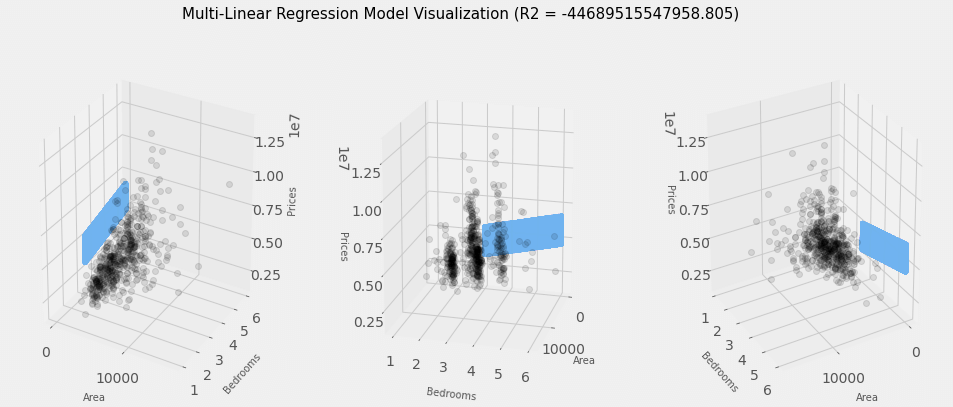
|
 For Videos Join Our Youtube Channel: Join Now
Feedback
- Send your Feedback to [email protected]
Help Others, Please Share


