| |
Python Tutorial
Python OOPs
Python MySQL
Python MongoDB
Python SQLite
Python Questions
Plotly
Python Tkinter (GUI)
Python Web Blocker
Python MCQ
Related Tutorials
Python Programs

Box-Cox Transformation in PythonIn our environment, data is distributed randomly, where some data refers to the peak value of the curve of the dataset, whereas some data points refer to the tail part of the curve. For any dataset, we can calculate the distribution using its variance and mean, and we can see how far the data is distributed to the mean value. Generally, we can divide the distribution of the data into two ways:
Normal distributionIn this type of distribution, the distribution of the data along the mean value is very consistent. Here, we get the peak value of the curve throughout the mean value, and data is distributed symmetrically along the mean value. We can easily implement analysis techniques on the normally distributed data. Power-law distributionIn this type of distribution, we will be having the peak of the curve for some small datasets, and then we will be having a long tail for the curve for a large number of datasets. But in the environment, the nature of data is not always normally distributed. So with the help of box-cox transformation, we can transform the power-law distributed data into the normally distributed data using some mathematical formula. The mathematical analysis for transformation is that we will find the value of such that the non-normally distributed transforms are as close as possible to the normally-distributed dataset. 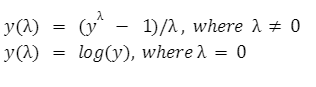
To implement box-cox transformation, we will use the scipy library, and the function will be the scipy.stats.boxcox() function. Syntax:InputArray This is the dataset which we want to transform into a normal-distributed dataset. Lamda If the lambda is none, we will find out the value of lambda that maximizes the value log function, and if it is not none then on the value of lambda, we perform the transformation. Alpha This is an optional parameter which takes a float value between 0.0 to 1.0. If the lambda is none, then it is taken under consideration, and if lambda is not none, it is ignored. Optimizer It is an optional and callable parameter which is called when it is needed. When the value of lambda is none, then this optimizer is used to find the value of lambda that minimizes the log function. Example:In this example, we will take the dataset of non-normal distribution, and then we will transform it into the normally-distributed dataset. Output: 
Explanation: In the above code, first, we have imported the required modules in the file like numpy,scipy, matplotlib and seaborn to plot the curve. Now with the help of the random function of numpy, we created the random dataset of 1200 data points. Now we use the boxcox() function, which takes the dataset as an argument and returns the transformed dataset and lambda value. Now using the histplot() function, we plotted the curve of the original dataset and transformed the dataset. The histplot() function takes a dataset as an argument, and it has many more attributes like color, linewidth etc., which define the specification of the curve. Now with the show() function, we have displayed the curve before the transformation and after the boxcox transformation. For the above random dataset, we got the lambda value as 0.2872, which is nearly equal to 0.28. So in the dataset, the new values will be according to this formula: New Value = (Old Value0.2872 -1)/0.2872
Next TopicAssertionError in Python
|
 For Videos Join Our Youtube Channel: Join Now
Feedback
- Send your Feedback to [email protected]
Help Others, Please Share


