| |

Music Recommendation System Python Project with Source CodeWhy use Python for this project?Over the years, Python has earned a superstar status in data science. All data fans adore it, and it offers a simple introduction to statistical science and machine learning. There are several built-in libraries for challenging data science projects, which are simple to create. Python's popularity is also due to its straightforward code readability. When compared to other complex languages, its syntax is skeletal and minimal. The list of libraries available for usage in Python for data science is incomplete, but it includes seaborn, Matlab, sci-kit learn, SciPy, pandas, requests, regex, NumPy, etc.
To assist you in beginning your educational path and gaining the practical experience required for a data science career, here is a selection of vetted Python data science projects. It's time to play around with Data Science Projects and experiment with different strategies for solving a business problem to gain data-driven insights. By offering visual and straightforward methods to organize and clean your data, software like Tableau Prep may assist you in fostering a great data culture. Tableau Prep features two products: Mondrian Prep Director for scheduling, managing, and monitoring flows throughout your company and Tableau Prep Builder for creating data flows. A data cleaning tool can let analysts or administrators begin their studies more quickly and with greater confidence in the data, saving an administrator a lot of time. Making successful and efficient business decisions requires understanding data quality and the tools taken to construct, manage, and transform data. This vital procedure will help your firm further establish a data culture. You can learn how design firm Tinuiti grew their advanced analytics for 500+ clients and centralized 100plus data sets in Tableau Prep by reading about how they did it. Music Recommendation System on KKBox DatasetToday's world is surrounded by music. By 2021, more than 70 million songs will be available on Spotify alone, proving how accessible music is. Other services include KKBox, Gaana, Saavn, and Apple Music. How can fresh content become found in a field with so much content currently available? The Recommendations system is how users discover new songs and develop new musical likes. Recommendation algorithms are profitable for music streaming businesses as well. They benefit from increased engagement and audience growth on their platform. In Asia, it is one of the largest streaming services is KKBox. Dataset DescriptionThe information includes music and user metadata. User- and song-specific information, such as the user ID'S, user Registration date, song ID'S, song genre, song ArtistName, and song release date, is included in the metadata. The information includes when a user plays a piece of music only once. For each song-user combination, this information is in particular. The dataset consists of three files:
Remove duplicate or pointless observations as well as undesirable observations from your dataset. The majority of duplicate observations will occur during data gathering. Duplicate data can be produced when you merge data sets from several sources, scrape data, or get from clients or other departments. One of the most important factors to consider in this procedure is de-duplication. Those observations are deemed irrelevant when you observe data that do not pertain to the particular issue you are attempting to study. For instance, you might eliminate those useless observations if you wish to examine data about millennial clients, but your dataset also includes observations from earlier generations. In addition to providing a more understandable and effective dataset, this can increase analysis efficiency and reduce divergence from your main aim. Step 1: Data Cleaning Anomalies, outliers, and missing values may be present in the dataset. These situations may affect how accurately and efficiently algorithms are implemented. A dataset contains 30-50% outliers or missing values. The data needs to be uniformly normalized throughout. Data cleansing is removing information from your dataset that does not belong there. The methods used to sanitize that data are the main topic of this essay. The process of changing data from one place or architecture to another is known as data transformation. Transformation activities are also known as data wrangling or data munging when translating data from one "hard" data form into another format for archiving and analysis. We employ the following methods to clean the data: 1. Outlier Recognition and Treatment. Outliers are ludicrous values and are outside the acceptable range for a label. For instance, a user's age below zero and above one hundred can be deemed ludicrous. It might be stricter in specific circumstances, such as when buying alcohol between 18 and 100. Benefits of data cleaning
Step 2: Addition of Missing Values Imputing entails substituting a different value for any lacking values in the dataset. We divide user-song pairings into two distinct categories: repetitions and non-repeats.
Step 3: Correct structural issues When you test or exchange data and find odd naming practices, typos, or wrong capitalization, such are structural faults. Mislabeled sections or classes may result from these inconsistencies. For instance, you might see both "N/A" and "Not Applicable," but they must be assessed as belonging to the same category. Step 4: Eliminate unwelcome outliers There will frequently be isolated findings that, at first look, seem to need to fit the data you are evaluating. Removing an outlier if you have a good reason to, such as incorrect data entry, will enhance the accuracy of the data you are currently working with. However, occasionally an outlier's appearance will support a theory you're working on. Remember that an outlier doesn't necessarily indicate that something needs to be fixed. To determine the reliability of the number, this step is necessary. If an outlier turns out to be incorrect or unimportant for the analysis, you should remove it. Step 5: Data standardization Data standardization allows you to recognize and transform data from many formats into standardized one. Data standardization can be useful if you don't have data restrictions at data entry or if company data have conflicting forms. In contrast to data validation, standardization procedures can be used on data that has already been gathered. This entails creating scripts to transform your soiled data into reliable ones. Matching strings: Use rigorous or fuzzy string-matching techniques to find exact and close matches with your data and legitimate values to standardize inconsistent data. By comparing your data characters to the expected valid values, you can eliminate or modify the strings that don't match. Libraries NumPy, Sklearn, and Pandas To develop a music recommendation system, the following 4 modelling strategies will be assessed in this project:
Decision Trees are gathered into a Random Forest. Recommended models As I've already mentioned, these music streaming sites use ML models to offer the songs you enjoy. These models are referred to as classes in the Recommendation Python package. We must import Pandas and Numpy libraries into this package: Let's now talk about the models that are applied to recommendations: Recommendation for Popularity:This algorithm suggests music to you that is trending or popular in your area. This model is based on the songs well-liked in your area or constantly played by system users. The source code of popularity recommendation Similarity Recommendation:Your daily music listening habits are taken into account by this model. For instance: Let's say you use Spotify to listen to Linkin Park's song Numb. After watching the songs, you may be given music recommendations such as Boulevard of Shattered Dreams by Green Day or At the End by Linkin Park because these songs have the same artist or genre. Source code: We now integrate them into a new file by using Python libraries necessary for this task and the Guid'seline package: Source code: After that, we'll open an a.csv file with the data and obtain the number of occasions a user has listened to each song in line five. Source code: Output: 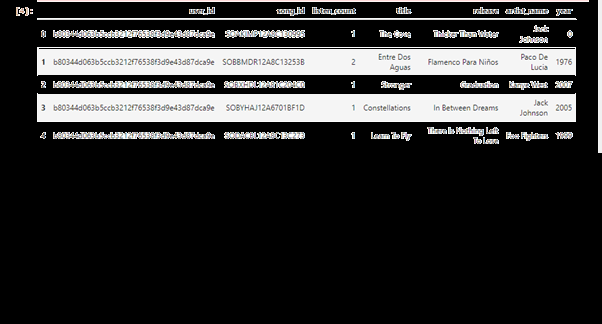
For better understanding, we will now display the number of songs, or the number of rows, in the dataset in the file. Source code: Output: Total no of songs: 2000000 Next, we'll build a dataframe from a portion of the provided dataset. Source code: Because the output is too long enough to display in full, I've excerpted it below. Output: Anyway - Armand Van Helden & A-TRAK Present Du. 5139 high fives - Four Tets 5142 in white rooms - Booka Shades 5132 paranoid's androids - Christophers O'Riley 5192 ¿LoVes? [Piano ¿LoVes? [Piano Y Voz] - Alehjandro Sanz 51502 Época - Gotan Project 512 rows × 3 columns 518 Your Love - The Outfield 7121 Your Mouth - Telefon Tel Aviv Ze Rook Naar Rozen - Rob De Nijs 7131 Zebra - Beach Houses 7132 Zebra - Man Mans 71332 Zero - The Pain Machinery 71352 Zopf: pigtail - Penguin Café Orchestra 7137s2 5123 Your Songs (Alternate Take 10) - Cilla Black2 7126 Your Visits Are Getting Shorter - Bloc Party2 7127 Your Woman - White Towns 7130 Ze Rook Naar Rozen - Rob De Nijs 7131 Zebra - Beach Houses 7132 Zebra - Man Mans 7133 Zero - The Pain Machinery 7132 Zopf: pigtail - Penguin Café Orchestra 5137s2 Anyway - Armand Van Helden & A-TRAK Present Du. 51392 high fives - Four Tets 51402 in white rooms - Booka Shades 51432 paranoid's androids - Christophers O'Riley 51492 LoVes [Piano ¿LoVes? [Piano Y Voz] - Alehjandro Sanz 51502 Época - Gotan Project 51512 rows × 3 columns
Next TopicPython counter add
|
 For Videos Join Our Youtube Channel: Join Now
Feedback
- Send your Feedback to [email protected]
Help Others, Please Share


