| |
Python Tutorial
Python OOPs
Python MySQL
Python MongoDB
Python SQLite
Python Questions
Plotly
Python Tkinter (GUI)
Python Web Blocker
Python MCQ
Related Tutorials
Python Programs

Missing Data Conundrum: Exploration and Imputation TechniquesMissing data is a most common and non-negotiable problem in statistical analysis and machine learning. They affect the data quality. It can happen due to various reasons such as the user not responding to questions in a recommender system, death of the patient on treatment or non-compliance, and so on. In this tutorial, we will discuss the importance of missing data and identify the reason for the missing data. Missing Data MechanismIn the current era, Data is treated as fuel means data is a most powerful thing. It can be used in many ways. But the incomplete data can lead to a problem. So first, we need to understand the importance of the data, and more importantly, we need to identify the reason for missing data occurrence comprehensively. The data collection process also plays an important role to identify the data collection errors. The mechanism of missing data can be categorized into three major classes. These categories are based on the nature of the missing data and observed data. These mechanisms are given below. Missing Completely at Random (MCAR) The nature of the missing data is related to the observed data but not the missing data. For example - Children are missing their classes because their parents are moving to a different city and hence, the children had to leave the study. Missing at Random (MAR) The nature of the missing data is related to the observed data but not the missing data. For example - Children are missing their classes because their parents moving to a different city and hence, the children had to leave the study. Missing Not at Random (MNAR) It is also known as non-ignorable because the missingness mechanism cannot be ignored. It can happen only when there are neither MCAR nor MAR. The missing value on the variable are related to that both of the observed and unobserved variables. For example - Parent refuses to send their children to study center due to the toxic atmosphere and they do not want to their children bullied. The problem with the MNAR data is intrinsically associated with the issue of identifiability. Understanding the data collection process and substantive scientific knowledge helps to assume a data mechanism. Statistical testing also helps to understand the type of missing data mechanism. There are many modules that can handle the missing data effectively, but the fancyimpute module is quite useful and popular. Fancyimpute ModuleMissing data plays an important role creating a predictive model; algorithms do not perform very well with missing dataset. Fancyimpute is a machine learning library for the missing data imputation algorithm. It uses a machine-learning algorithm to impute missing values. Fancyimpute uses the entire column to impute the missing values. It provides the two ways to impute the missing data
K-Nearest NeighborKNN finds out similar data points among all the features and fill out the missing value. Let's understand the following example. Example - Output: A B C D 0 NaN 1.0 NaN 0 1 2.0 7.0 NaN 1 2 NaN NaN NaN 5 3 NaN 8.0 NaN 4 4 9.0 7.0 8.0 2 5 2.0 5.0 7.0 9 Imputing row 1/6 with 2 missing, elapsed time: 0.001 [[4.80735271 1. 7.70802941 0. ] [2. 7. 7.57627146 1. ] [5.29411783 7.49760549 7.64000033 5. ] [6.2499999 8. 7.87179494 4. ] [9. 7. 8. 2. ] [2. 5. 7. 9. ]] Multiple Imputations by Chained EquationIn this method, mice use the multiple imputations instead of single imputation. It performs multiple regressions over the sample data and takes averages of them. Let's understand the following example. Example - Output:
    A     B     C     D
0   NaN  15.0   1.0   NaN
1  23.0  40.0   NaN   1.0
2   NaN   NaN   NaN   5.0
3   NaN   3.0   NaN   4.0
4  15.0  70.0  28.0  29.0
5  20.0  35.0  57.0  91.0
[[ 32.13508529  15.           1.         -76.25883183]
 [ 23.          40.          23.80426163   1.        ]
 [ 24.47759791  32.58430591  26.67745156   5.        ]
 [ 31.14858991   3.          32.06817994   4.        ]
 [ 15.          70.          28.          29.        ]
 [ 20.          35.          57.          91.        ]]
Handling Missing DataThere are many methods available to treat the missing data in the literature, textbook and standard courses. We have discussed one of the important methods as a fancyimputer. However, these methods consist of some drawbacks. When using the data mining process, one need to be careful to avoid bias or overestimate variability; these methods don't perform well. 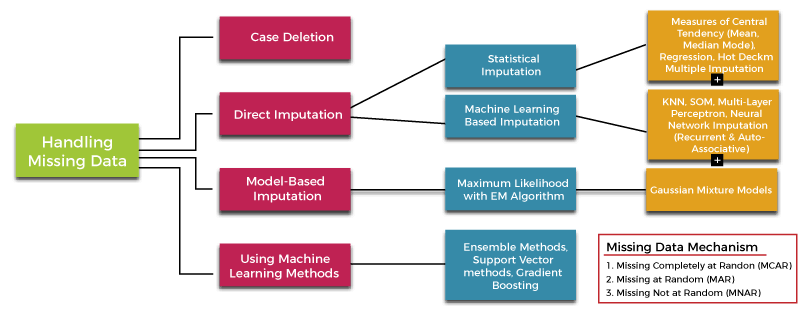
Case DeletionThere are two types of case deletion methods. The first one is a list deletion (also known as complete case analysis) and second method is the pair deletion. The case deletion methods are used to delete the missing cases from our dataset on an analysis-by-analysis basis. Let's create a dummy dataset which contains some missing values using pandas dataframe. Example - 1 Output:
    Name   Age  Sex  Goals  Assists  Value
0   John  21.0    M    5.0      7.0   55.0
1   Paul  23.0  NaN   10.0      4.0   84.0
2    NaN   NaN  NaN    NaN      NaN    NaN
3   Wale  19.0    M   19.0      9.0   90.0
4   Mary  25.0    F    5.0      7.0   63.0
5  Carli   NaN    F    0.0      6.0   15.0
6  Steve  15.0    M    7.0      4.0   46.0
In the above code, we have created the new dataset that contains missing values. We can remove the missing values using the df.dropna() method that removes all the missing value. Let's see the below output. Example - 2: Output: Name Age Sex Goals Assists Value 0 John 21.0 M 5.0 7.0 55.0 3 Wale 19.0 M 19.0 9.0 90.0 4 Mary 25.0 F 5.0 7.0 63.0 6 Steve 15.0 M 7.0 4.0 46.0 We can also use the df.dropna(how = 'all') which removes just the rows with the missing values. We can also specify removing a column with the missing values using df.dropna(axis = 1, how = 'all'). Let's understand the below example. Example - 2 Output:
    Name   Age  Sex  Goals  Assists  Value
0   John  21.0    M    5.0      7.0   55.0
1   Paul  23.0  NaN   10.0      4.0   84.0
3   Wale  19.0    M   19.0      9.0   90.0
4   Mary  25.0    F    5.0      7.0   63.0
5  Carli   NaN    F    0.0      6.0   15.0
6  Steve  15.0    M    7.0      4.0   46.0
Example - 3 Output:
    Name   Age  Sex  Goals  Assists  Value
0   John  21.0    M    5.0      7.0   55.0
1   Paul  23.0  NaN   10.0      4.0   84.0
2    NaN   NaN  NaN    NaN      NaN    NaN
3   Wale  19.0    M   19.0      9.0   90.0
4   Mary  25.0    F    5.0      7.0   63.0
5  Carli   NaN    F    0.0      6.0   15.0
6  Steve  15.0    M    7.0      4.0   46.0
ConclusionIn this tutorial, we have discussed the importance of missing data in data science projects. It reviews exploration techniques and important imputation methods used for handling missing data. We have also described the method of handling the missing value. A wildly used model assumes a joint distribution of all the missing values and estimates the model parameters describing the observed data. |
 For Videos Join Our Youtube Channel: Join Now
Feedback
- Send your Feedback to [email protected]
Help Others, Please Share


