| |
Python Tutorial
Python OOPs
Python MySQL
Python MongoDB
Python SQLite
Python Questions
Plotly
Python Tkinter (GUI)
Python Web Blocker
Python MCQ
Related Tutorials
Python Programs

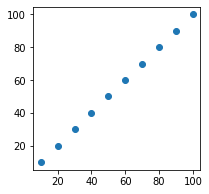
How to Change Plot Size in MatplotlibIn Data visualization, plots are the most effective ways of representing the data visually. If it is not plotted in a detailed form it can appear complicated. Python has Matplotlib, which is used for representing data in the plotting form. The user should optimize the size of the plot while creating it. In this tutorial, we will discuss various methods for changing the default plot size as per the required dimensions of the user or resize the given plot. Method 1: By using set_figheight() and set_figwidth()The user can use set_figheight() for changing the height and set_figwidth() for changing the width of the plot. Example: Output: The plot is plotted in its default size: Method 2: By using figsize() functionThe figsize() function takes two parameters, that is, width and height in inches. By default, the values of width = 6.4 inch and height = 4.8 inch. Syntax: Where x_axis is the width and y_axis is the height in inches. Example: Output: The plot is plotted in its default size: Method 3: By changing the default rcParamsThe user can change the default size permanently of the figure as per their needs by setting the figure.figsize. Example: Output: The plot is plotted in its default size:
Next TopicHow to Get the Zip Code in Python
|
 The plot is plotted after changing its size:

 The plot is plotted after changing its size:

 The plot is plotted after changing its size:

 For Videos Join Our Youtube Channel: Join Now
Feedback
- Send your Feedback to [email protected]
Help Others, Please Share


