| |

Visualising Global Population Datasets with PythonMany public bodies like government, facing issues on national contexts like growing population. So, it would be helpful to visualize Global population to help the government solve these issues. To do so it requires mapping data on distribution of populations with the help of technology like AI and ML models Few metrics to carry out the whole process are
In developing nations, especially, the latest wave of high resolution (HR) population estimate census layers has the potential to have a significant impact on public sector decision-making. The data for the mapping layers is gathered using unconventional methods, such as satellite images. As a result, they can offer population estimates for each grid cell on the planet with a resolution of 30 metres. APIs (application programming interfaces) allow users to access their most recent changes online, making them potentially highly significant resources for decision-makers who rely heavily on data. These high-resolution population maps solve a number of important shortcomings of the conventional administrative or statistical census of population data. For a variety of descriptive and prescriptive analytics, data sets like the Facebook Research HD Settlement Layer and World Pop, which use new generation techniques for high-resolution population estimates, may be easily deployed. The WorldPop Project was founded in 2013 with the intention of making population and demographic statistics accessible to anyone in order to enable applications for development, disaster relief, and health. It incorporates digital mapping, satellite images, and micro-census surveys conducted at the national level in local regions on a neighbourhood size. To put it briefly, WorldPop used machine learning modelling (random forest) to derive excellent quality national population. The population Counts and high-quality Population Density Maps from Facebook are shown in this tutorial in order to visualise the population counts at various administrative units for Vietnam in attempt to Visualising Global Population Datasets using Python. We also require information describing the digital borders of Vietnam as the shapefiles in order to be able to extract the projected population count for various administrative units. Therefore, three datasets are needed for this analysis: administrative boundary data from GADM, Facebook, and WorldPop. There are 4 steps in the data analysis:
Data Exploration and AnalysisLoad and Explore data on Administrative Boundaries from GADMDataset source: GADM( it is the database of global admin areas), is an excellent quality database that defines 386,775 administrative areas around the world as of its most recent iteration. After downloading the Vietnam country-level data, the folder that emerged had the following organisational structure. 
The administrative level at which the borders are accessible is indicated by the file's index ( 0,1,2,3 ). With 63 polygons total under ADM Level 1, Vietnam is organised into fifty-eight provinces and five cities under the control of the federal government. The second-level administrative subdivisions of Vietnam's provinces are then split into districts, regional cities, and townships at the district level. The municipalities are split into wards, which are then further divided into urban districts, rural districts, and district-level towns. Thus, Vietnam's 686 level 2 and 7658 level 3 administrative entities are included in the GADM data. Source Code Snippet: Output: 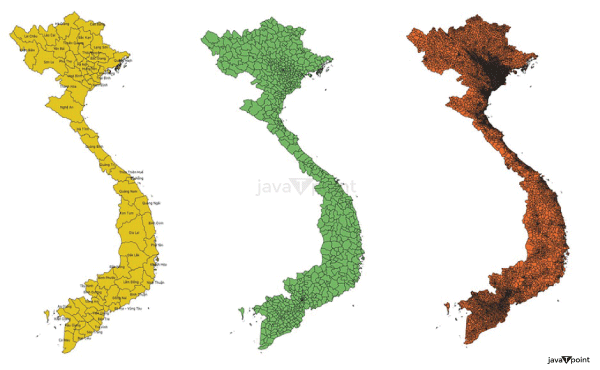
Figure: Level 1, 2, and 3 units of Vietnam Load and Explore Population Data from WorldPopWe obtained the Vietnam population per pixel ( PPP ) data in raster format from WorldPop with a 100m resolution that has been modified to correspond to UN national estimates. To read the raster data obtained as a tif file, we employ rasterio, a GDAL and numpy-based Python package. vietnam__worldpop__raster = rasterio.open( 'vnm__ppp__2020__UNadj.tif' ) Any pixelated data that has a defined geographic location assigned to each pixel is referred to as raster data. A pixel's value might be categorical ( like land use ) or continuous ( like elevation ). The only way a geographic raster differs from a digital image is if spatial information is included to link the data to a specific location. The extent, cell size, number of rows and columns, and the coordinate reference system ( CRS ) of the raster are all included in this. One or more layers referred to as bands make up a raster dataset. A multispectral picture may contain multiple bands, whereas a colour image has three separate bands ( red, a shade of green and blue ), a model of the elevation has one band ( storing elevation values ), and a colour image has three bands ( green, blue, and red ). Source Code Snippet Output: 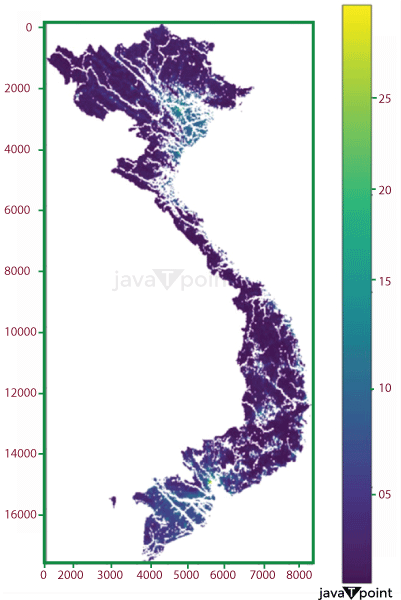
WorldPop Raster Layers in VietnamSource Code Snippet: Vietnam has a total population of 97.54 million people, according to the raster layer. In order to determine population counts inside each of the 63 provinces + municipalities ( level 3 administrative entities ) of Vietnam, we then mask this raster layer using the polygons retrieved from the GADM dataset. The raster__layer population count within a vector__polygon is returned by the following method. Source Code Snippet: By including a column named population__count__wp that contains the population estimate for the ADM first level based on the WorldPop raster data, the code produces the result. The code snippet below is then used to visualise the overall population estimate using the Plotly Choropleth map. Source Code Snippet: Output: 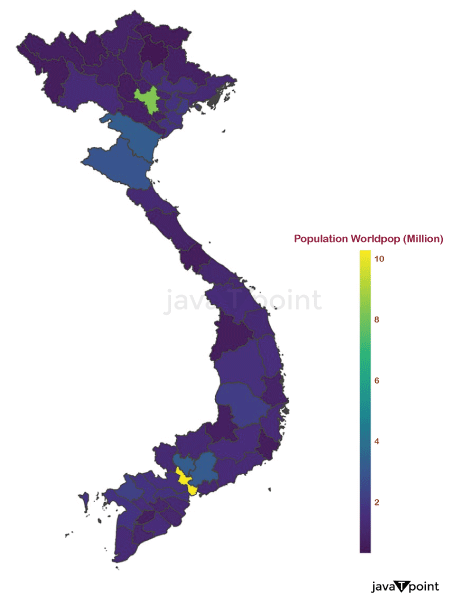
Figure: Population in millions for the districts of Vietnam Load and Explore Population Data from FacebookYou may download the Facebook population map for Vietnam at HDX as a tif file or a CSV file. It estimates the population within 30-meter grid tiles. We provide here the CSV file received in the following format, same as we did while prepping the WorldPop data in tif format. Source Code Snippet: Output: 135 Output: 95 Input: Output:
array( [ 'Gabon' , 'Mongolia' , 'Belgium' , 'R�union' , 'The Bahamas' , 'Uganda' ,
'Cape Verde' , 'Antigua and Barbuda' , 'Benin' , 'Belize' , 'Niger' ,
'Rwanda' , 'Togo' , 'Denmark' , 'Angola' , 'Israel' , 'Kuwait' ,
'Greece' , 'Burkina Faso' , 'Kyrgyzstan' , 'United Arab Emirates' ,
'Australia' , 'Haiti' , 'Slovakia' , 'Pakistan' , 'Lebanon' ,
'Botswana' , 'Barbados' , 'South Africa' , 'Austria' , 'Bolivia' ,
'Mauritius' , 'Zimbabwe' , 'Lithuania' , 'Cameroon' , 'Libya' ,
'Mozambique' , 'Namibia' , 'Oman' , 'Norway' , 'Jordan' ,
"C�te d'Ivoire", 'Netherlands' , 'Senegal' , 'Canada' ,
'Saudi Arabia' , 'France' , 'El Salvador' , 'Jamaica' , 'Czechia' ,
'Estonia' , 'Chile' , 'Malaysia' , 'Poland' , 'Nicaragua' ,
'New Zealand' , 'Germany' , 'Philippines' , 'Paraguay' , 'Honduras' ,
'Finland' , 'Uruguay' , 'Spain' , 'Italy' , 'Hungary' , 'Portugal' ,
'Sweden' , 'Croatia' , 'Guatemala' , 'Ecuador' , 'Argentina' ,
'Tanzania' , 'Cambodia' , 'Ireland' , 'Peru' , 'Switzerland' , 'Brazil' ,
'Egypt' , 'Bulgaria' , 'Dominican Republic' , 'Colombia' , 'Mexico' ,
'Indonesia' , 'India' , 'Nigeria' , 'Kenya' , 'Romania' , 'Japan' ,
'United States' , 'Latvia' , 'Slovenia' , 'Vietnam' , 'Puerto Rico' ,
'Turkey' , 'United Kingdom' ], dtype = object )
Input: Output: 42 Input: Output:
array( [ 'Belgium' , 'Uganda' , 'Rwanda' , 'Denmark' , 'Israel' , 'Australia' ,
       'Slovakia' , 'Lebanon' , 'Austria' , 'Bolivia' , 'Zimbabwe' ,
       'Lithuania' , 'Cameroon' , 'Mozambique' , 'Norway' , 'Netherlands' ,
       'Canada' , 'France' , 'Czechia' , 'Chile' , 'Poland' , 'Honduras' ,
       'Finland' , 'Spain' , 'Italy' , 'Portugal' , 'Sweden' , 'Guatemala' ,
       'Ecuador' , 'Argentina' , 'Tanzania' , 'Peru' , 'Brazil' , 'Bulgaria' ,
       'Colombia' , 'India' , 'Nigeria' , 'Romania' , 'United States' ,
       'Slovenia' , 'Turkey' , 'United Kingdom' ], dtype = object )
Input: Output:
array( [ nan, 'An Giang Province' , 'Ba Ria - Vung Tau' , 'Bac Giang' ,
       'Bắc K?n Province' , 'Bac Lieu' , 'Bac Ninh Province' , 'Ben Tre' ,
       'Binh Dinh Province' , 'Binh Duong' , 'Binh Phuoc' ,
       'Bình Thuận Province' , 'Ca Mau' , 'Cần Th?' , 'Cao Bang' , 'Da Nang' ,
       'Đắk Lắk Province' , 'Dak Nong' , 'Dien Bien' , 'Dong Nai' ,
       'Đồng Tháp Province' , 'Gia Lai' , 'Ha Giang' , 'Hà Nam' , 'Ha Tinh' ,
       'Hai Duong' , 'Haiphong' , 'Hanoi' , 'Hau Giang' , 'Ho Chi Minh City' ,
       'Hoa Binh' , 'Hung Yen' , 'Khanh Hoa Province' , 'Kien Giang' ,
       'Kon Tum Province' , 'Lai Chau' , 'Lâm Đồng' , 'L?ng S?n' , 'Lao Cai' ,
       'Long An Province' , 'Nam Dinh' , 'Nghe An' , 'Ninh Bình Province' ,
       'Ninh Thuan Province' , 'Phu Tho Province' , 'Phú Yên Province' ,
       'Quang Binh Province' , 'Quang Nam Province' , 'Quang Ngai' ,
       'Quảng Ninh' , 'Quảng Tr? Province' , 'Soc Trang' , 'Son La' ,
       'Tây Ninh Province' , 'Thai Binh' , 'Thai Nguyen' , 'Thanh Hoa' ,
       'Thua Thien Hue' , 'Tien Giang' , 'Tra Vinh' , 'Tuyên Quang' ,
       'Vinh Long' , 'Vinh Phuc Province' , 'Yên Bái' ], dtype = object )
Longitude, latitude, and population estimates for the sites as of 2015 and 2020 are included in the CSV file. According to Facebook data, Vietnam has 98.16 million people overall. We must turn this the data frame into a geodataframe with a geometry field in order to apply the geospatial tools and methods presented with WorldPop data. Source Code Snippet: Then, using the masking algorithm for the vector layer with a polygon, we obtain the population counts for each set of administrative borders. Source Code Snippet: Using the code below, we next use Plotly to create the choropleth map. Source Code Snippet: Output: 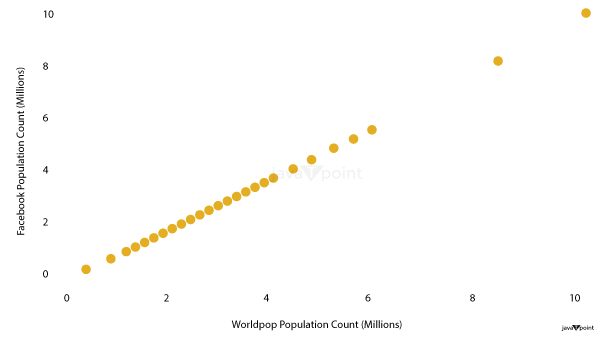
ConclusionsNow that the two mapping layers have been displayed in a JPNE, we can compare the findings via the lens of administrative definitions, which is more known to most policymakers. With the scatterplots shown below, we may visualise comparison ratios of Worldpop against Facebook results to achieve this. A 45-degree line would imply that the outcomes are the same regardless of the location. The population numbers from Facebook and Worldpop at the provincial/municipal level exhibit a strong connection. Comparing Facebook's population estimate to WorldPop's at the second organisational level, particularly in some of the towns like Binh Duong and Ho Chi Minh, the former provides a far lower estimate of the latter's. The question posed ultimately determines if this is a problem. JPNEs make it possible to quickly assess the degree to which choosing a particular source of information over another has a significant impact on the current problem. Platform and data advancements in digital technology offer a combination to tackle a variety of policy issues. However, these concludes active partnerships between domain experts and data scientists, engineers, and programmers.
Next TopicHill Cipher in Python
|
 For Videos Join Our Youtube Channel: Join Now
Feedback
- Send your Feedback to [email protected]
Help Others, Please Share


