| |

App User Segmentation in PythonThe task of classifying users depending on how they interact with the app is known as app user segmentation. It assists in locating retained users, determining the group of customers for a marketing campaign, and solving a variety of other business difficulties involving the search for users with comparable characteristics. This post is for you if you want to discover how to segment app users. In this tutorial, I'll guide you through the process of app customer segmentation using Machine Learning and Python. App User SegmentationIn order to solve the challenge of app user segmentation, we must categorise users depending on how they interact with the app. So, in order to overcome this problem, we need data on users depending on how they interact with the app. I discovered a dataset containing information on how users who use an app on a regular basis and users who have uninstalled the app interacted with it. This information may be utilised to segment users and identify retained and churn consumers. App Users Segmentation: A brief Case StudyBusinesses and app developers must identify and target certain user categories to better engagement and keep more users to raise lifetime value in the increasingly competitive world of applications. Here is a dataset we gathered from an app in order to discover a data-driven method to segmenting app users according to their usage behaviours and spending capabilities in order to identify consumers who the app would retain and lose over time. All of the characteristics in the dataset are listed below:
Discover relationships between users who are still using the programme and those who have uninstalled it, and establish user segments to better understand the maintained users and those who can be maintained before moving on to other options. Main table of dataset (for reference purpose only):
In the part below, I'll walk you through the process of App User Segment using Machine Learning using Python. Python App User SegmentationLet's get started with App User Segment by importing the essential Python modules and dataset: Code snippet: Output: userid Mean Screen Time Mean Spent on App ( INR ) Left Review \ - - - - - - - - - - - - - - - - - - - - - - - - - - - - - - - - - - - - - - - - - - - - - - 0 1001 17.0 634.0 1 1 1002 0.0 54.0 0 2 1003 37.0 207.0 0 3 1004 32.0 445.0 1 4 1005 45.0 427.0 1 Ratings New Password Request Last Visited Mins Status - - - - - - - - - - - - - - - - - - - - - - - - - - - - - - - - - - - - - - - - - - - - - - - 0 9 7 2990 Installed 1 4 8 24008 Uninstalled 2 8 5 971 Installed 3 6 2 799 Installed 4 5 6 3668 Installed To begin, consider the greatest, lowest, and mean time spent on screens of all users: Code snippet: Output: Mean Screen Time = 24.39039039039039 Highest Screen Time = 50.0 Lowest Screen Time = 0.0 To begin, consider the greatest, lowest, and mean time spent on screens of all users: Code snippet: Output: Mean Spend of the Users = 424.4154154154154 Highest Spend of the Users = 998.0 Lowest Spend of the Users = 0.0 Now consider the link between active users' spending capacity and screen time and users who have discontinued the app: Code snippet: Output: 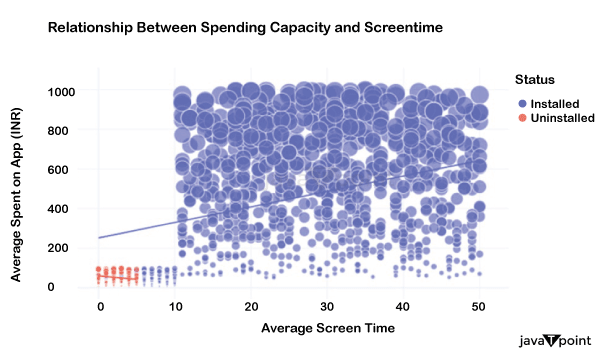
So this is fantastic! Users who deleted the app had a median screen time of less than 5 mins per day and spent less than 100 dollars. There is also a linear association between mean computer time and mean expenditure of users who are still using the app. Let's have a peek at the link between user ratings and mean screen time now: Code snippet: Output: 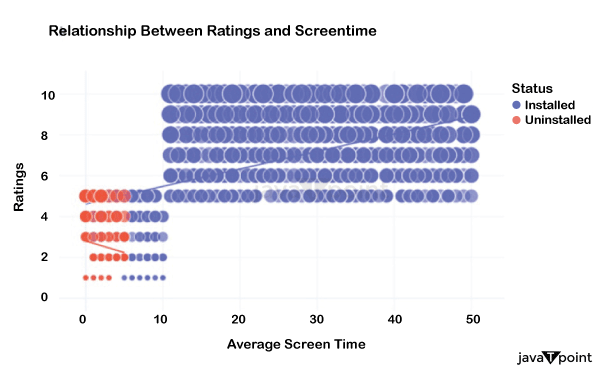
As we can see, people that deleted the app awarded it a maximum of five stars. In comparison to people who ranked higher, their screen time is quite short. As a result, customers who dislike spending more time with the programme grade it low and remove it at some point. App User Segmentation to Identify Retained and Dropped UsersNow, let's look into App User Segmentation to see who the app kept and who it lost permanently. For this challenge, I will use the K-means clustering technique in Machine Learning: Code snippet: Output: userid Mean Screen Time Mean Spent on App ( INR ) Left Review \ - - - - - - - - - - - - - - - - - - - - - - - - - - - - - - - - - - - - - - - - - - - - - - - - - - - - - - 0 1001 17.0 634.0 1 1 1002 0.0 54.0 0 2 1003 37.0 207.0 0 3 1004 32.0 445.0 1 4 1005 45.0 427.0 1 5 1006 28.0 599.0 0 6 1007 49.0 887.0 1 7 1008 8.0 31.0 0 8 1009 28.0 741.0 1 9 1010 28.0 524.0 1 Ratings New Password Request Last Visited Mins Status Segments - - - - - - - - - - - - - - - - - - - - - - - - - - - - - - - - - - - - - - - - - - - - - - - - - - - - - - 0 9 7 2990 Uninstalled 0 1 4 8 24008 uninstalled 2 2 8 5 971 Uninstalled 0 3 6 2 799 installed 0 4 5 6 3668 Uninstalled 0 5 9 4 2878 installed 0 6 9 6 4481 Uninstalled 0 7 2 1 1715 installed 0 8 8 2 801 Uninstalled 0 9 8 4 4621 Uninstalled 0 Let's take a look at how many portions we have: Code snippet: Output: 0 910 1 45 2 44 Name: Segments, dtype: int64 Let's rename the portions for easier comprehension: Code snippet: Let us now see the segments: Code snippet: Output: 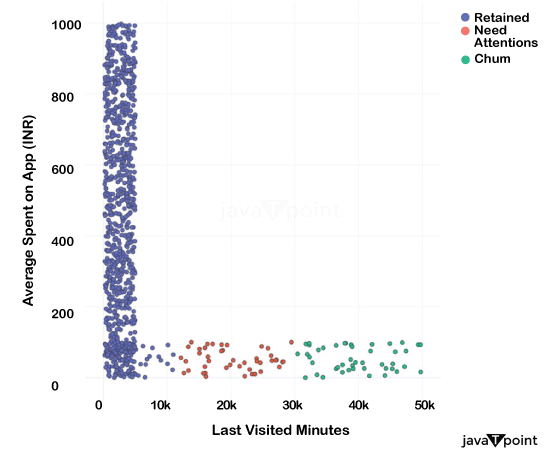
The blue section represents the number of users kept by the app over time. The red segment represents users who have recently removed the programme or are planning to do so. The green segment represents the number of users that the programme has lost. SummaryAs a result, you may categorise users based on how they interact with the app. App user segmentation assists organisations in finding retained users, determining the user segment for a promotional initiative, and solving a variety of other business challenges that require searching for users based on comparable criteria. I hope you enjoyed my post on Segmenting App Users Using Machine Learning in Python. |
 For Videos Join Our Youtube Channel: Join Now
Feedback
- Send your Feedback to [email protected]
Help Others, Please Share


