| |
Python Tutorial
Python OOPs
Python MySQL
Python MongoDB
Python SQLite
Python Questions
Plotly
Python Tkinter (GUI)
Python Web Blocker
Python MCQ
Related Tutorials
Python Programs

Visualize Tiff File using Matplotlib and GDAL in PythonThe file format TIFF is utilized for the storage of images that are rasterized. A library named GDAL Geospatial Data Abstraction Library is specifically designed to read these raster files, as well as other file formats, such as vector formats. The gdal library is part of the Open-Source Geospatial Foundation. To install required modules, we can use following commands in our terminal: We require matplotlib and GDAL modules within Python to display a tiff image. Approach:
To explain this tutorial, we will be using the following image in tiff format: 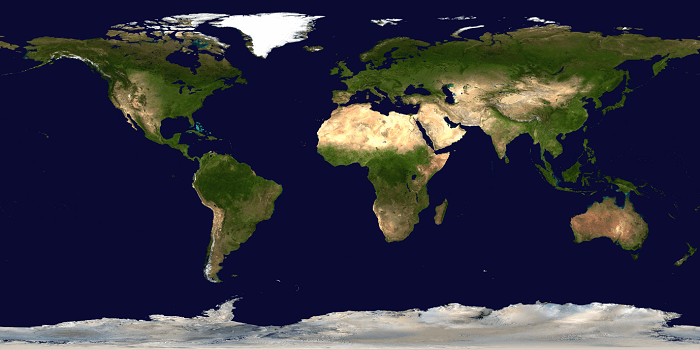
Step-by-step Implementation:Step 1: Importing the modules and opening the file. Step 2: Counting the total number of bands. Output: 3 Step 3: Fetching the bands We utilize the GDAL's GetRasterBand(int) to get the bands. It is important to note that the value that we pass will always begin with one (indexing of bands starts at 1) Step 4: Reading the bands as NumPy arrays. GDAL offers the ReadAsArray() method to convert those bands in NumPy arrays and returns the arrays. Step 5: Plotting the arrays using imshow() function of matplotlib. For plotting the three arrays, we'll stack them up in order. Final code: Final Output: 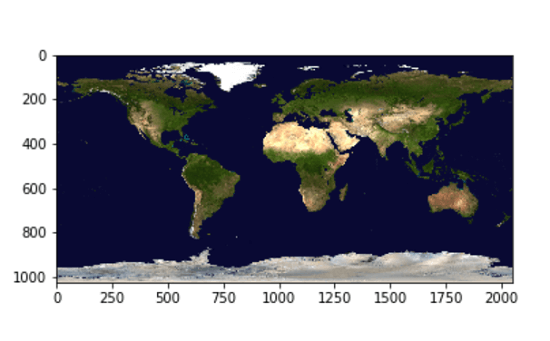
ConclusionIn this tutorial, we have discussed how we can visualize tiff file format images by using matplotlib and glad modules in Python.
Next Topicrarfile module in Python
|
 For Videos Join Our Youtube Channel: Join Now
Feedback
- Send your Feedback to [email protected]
Help Others, Please Share


