| |
Python Tutorial
Python OOPs
Python MySQL
Python MongoDB
Python SQLite
Python Questions
Plotly
Python Tkinter (GUI)
Python Web Blocker
Python MCQ
Related Tutorials
Python Programs

Box Plot in Python using MatplotlibWhat is Box Plot?A Box plot is a way to visualize the distribution of the data by using a box and some vertical lines. It is known as the whisker plot. The data can be distributed between five key ranges, which are as follows:
Here IQR represents the InterQuartile Range which starts from the first quartile (Q1) and ends at the third quartile (Q3). Box Plot visualization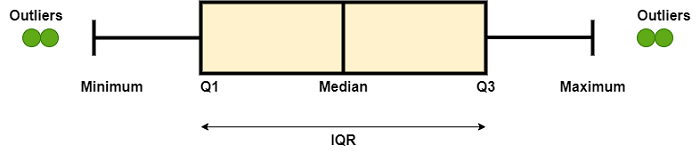
In the box plot, those points which are out of range are called outliers. We can create the box plot of the data to determine the following:
The range of the data from minimum to maximum is called the whisker limit. In Python, we will use the matplotlib module's pyplot module, which has an inbuilt function named boxplot() which can create the box plot of any data set. Syntax:In the boxplot() function, we have a lot of attributes which can be used to create a more attractive and amazing box plot of the data set.
Example1:We will create the random data set of the numpy array and create the box plot. Output: 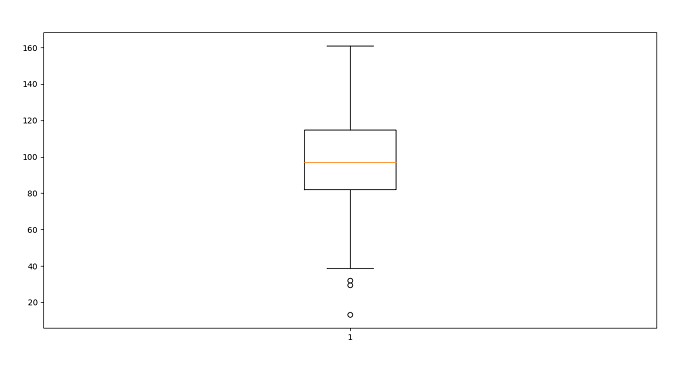
Explanation: In the above code, first of all, we have imported the numpy and matplotlib libraries in the code. Then we created the random dataset and plotted the box plot using the boxplot() function. Example2:We can create multiple box plots simultaneously in the same file. Output: 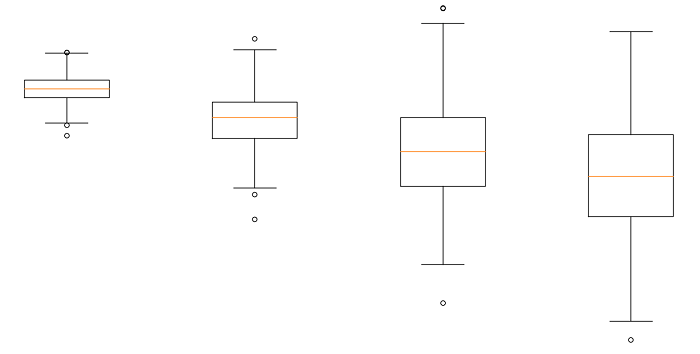
Explanation: In the above code, we have four data sets using random methods of numpy. Then we have created the list of the four data sets and use this inside boxplot() function. Example 3:We can use some attributes of the boxplot() function to customize the plot. Output: 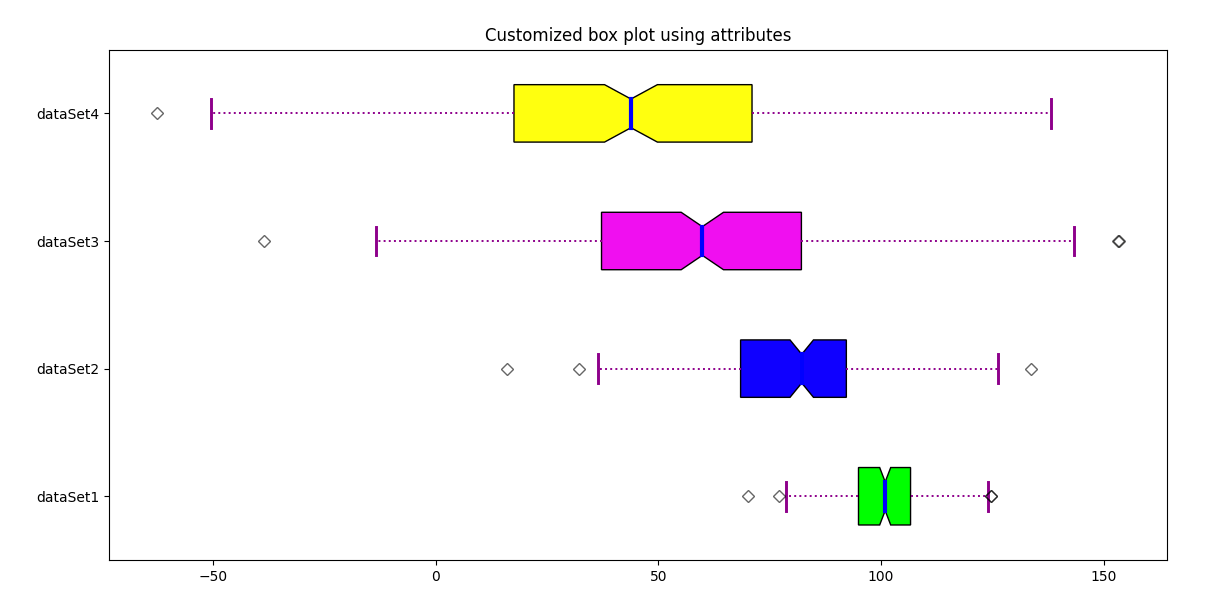
Explanation: In the above code, we have created the four datasets using random functions and set them in a list. Now we have set the different colors for each box plot using the list of colors and using the function set_facecolor(). We have set the line width of each box plot and also set the labels for each box plot. We have set attribute vert =0, which means all the plots will be in horizontal mode.
Next TopicBox-Cox Transformation in Python
|
 For Videos Join Our Youtube Channel: Join Now
Feedback
- Send your Feedback to [email protected]
Help Others, Please Share


