| |

Netflix Data Analysis using PythonData analysis is an effective technique that supports corporate decision-making. In today's tutorial, we'll use Python to investigate the Netflix information set and find intriguing findings. One of the world's largest and most popular online services, Netflix gives customers access to a vast library of television series and films. The site has amassed a sizable following recently, and its popularity appears strong. In this tutorial, we'll demonstrate how to use Python to do exploratory info analysis (EDA) on a piece of information set from Netflix that we obtained on Kaggle. To visualize and analyze the information, we'll use a variety of Python packages, such as Pandas, Seaborn, Matplotlib, and Plotly. 
Netflix movies DatasetYou'll need a few items before you can begin this course. Understanding Python's built-in data structures, particularly lists and dictionaries, comes first. Check see Dictionaries in Python and Lists and Tuple data structure in Python for further details. A functional Python environment is the second item you'll need. Any interface that has Python 3 loaded will let you follow along. Run the code samples in a Jupyter notebook if you want to see prettier results, especially for the huge NBA dataset you'll be using. Before you can start this course, you will need a few things. The first step is to comprehend Python's built-in data structures, especially lists and dictionaries. For more information, check Python's dictionaries, lists, and multiple structure sections. The second thing you need is a working Python environment. You may follow along on any interface that has Python 3 loaded in it. If you want to see nicer results, notably for the huge Netflix movies dataset you'll be utilising, run the code examples in a Jupyter notebook. Netflix Movies Table (sample dataset which we are going to use in my ML model training and testing):
Import Libraries & Loading InformationSource Code Snippet The first five rows of the information set, which has 12 columns and is visible, are made up of television programs and motion pictures uploaded on September 8, 2020. We can identify if it is a TELEVISION show or a movie from the kind column. Now that the Info has been cleaned up let's investigate it further by visualizing it. Note: Are you aware that there are several package managers available in the Python community and uncertain about which one to choose? Both pip and conda are great options, and each one has merits.
Source Code Snippet
|
| show_id | 0 |
| type | 0 |
| title | 0 |
| director | 2634 |
| cast | 825 |
| country | 831 |
| date_added | 10 |
| release_year | 0 |
| rating | 4 |
| duration | 3 |
| listed_in | 0 |
| description | 0 |
| dtype:int64 | 3 |
Explanation: Your dataset's columns are listed together with the kinds of data that each one includes. The data types int64 and object are shown here. Pandas works with these kinds using the NumPy library. The more complicated categorical information type, which the pandas Python module implements directly, will be introduced to you later.
A unique data type is the object data type. The object data type, according to the pandas Cookbook, is "a catch-all for data that pandas doesn't recognise as any other specific type." In actuality, it frequently denotes that the column's values are all strings.
The object data type allows you to store any Python object, but you ought to become aware of its limitations. Odd values in an object field can negatively affect pandas' performance and ability to work with other libraries. Check out the company's getting started manual for additional details.
. The following columns have values null that need to be cleaned:
director ? 2,634 values null
- cast ? 825 values null
- country ? 831 values null
- date__added ? 11 values null
- rating ? 4 values null
- duration ? 3 values null
Note: ou might also download the CSV file using your web browser.
But using a download script offers a number of benefits:
You can identify the source of your data.
The download is repeatable at any time! If the data is often updated, that is extremely useful.
The 17MB CSV file doesn't need to be distributed to your coworkers. Usually, sharing the download script is sufficient.
Source Code Snippet
Explanation: There are two ways we might respond to the "Country" column. First, since Netflix was founded in the USA, we might substitute "USA" for all the NaN values. As the nations for these films were not indicated in the Info, we may also substitute the NaN values with "Not Specified." We may substitute missing values for columns like "Director" and "Cast" with "No Director" and "No Cast," respectively. We can keep our Info by replacing the values in these columns rather than removing them.
Since the absence of value counts for other categories like date added, its duration, stem, and rating is so low, we'll remove them from the information set.
Source Code Snippet
Output:
| Dramas, International films | 462 |
| Documentaries | 449 |
| Stand-Up Comedy | 444 |
| Comedies, Dramas, International Films | 274 |
| Dramas, Independent Films, International Films | 242 |
| Crime TELEVISION Shows, International TELEVISION Shows, TELEVISION Sci-Fi & Fantasy | 11 |
| International TELEVISION Shows, TELEVISION Horror, TELEVISION Sci-Fi & Fantasy | 11 |
| Crime TELEVISION Shows, Children' TELEVISION | 12 |
| Horror Films, International Films, Sci-Fi & Fantasy | 13 |
| Cult Films, Dramas, Thrillers | 14 |
Explanation: The result reveals 461 distinct values in the 'listed__in' column. The value 'Documentaries' occurs the most frequently, appearing in 299 instances, followed by 'Stand-Up Comedy' has 273 occurrences, then 'Dramas, International Films' with 248 instances. The least frequent numbers have a single occurrence each.
As you can see, just 11 pieces of Info in our rating column must be included. You may either replace them or remove them. Since TELEVISION-MA is the most often used rating, all these nan values can be substituted with TELEVISION-MA.
Data Analysis
Source Code Snippet
Output:
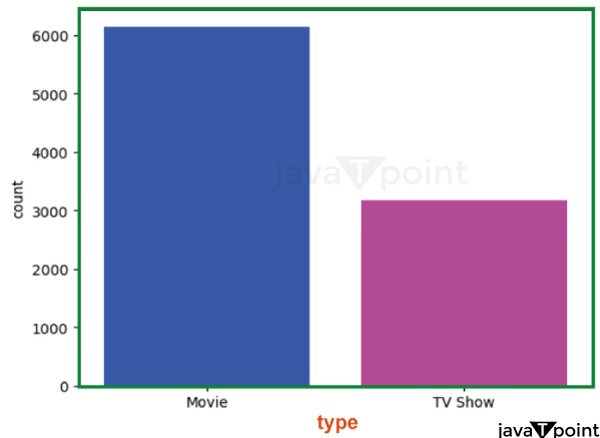
Explanation: It displays how many films and television series are included in the information set. The figure demonstrates that the information set contains more films than TELEVISION programs.
Source Code Snippet
Output:
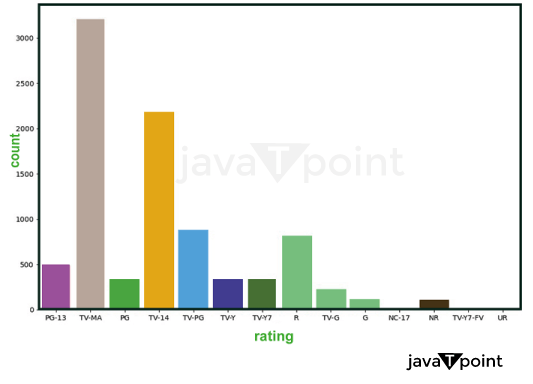
Explanation: A count plot of the 'rating' column of the 'df1' InfoFrame is shown in the second output. The 'rating' column displays the quantity of each distinct value. The figure demonstrates that TELEVISION-MA is the information set's most overall rating, followed by TELEVISION-14 and TELEVISION-PG. From there, we built a straightforward countplot and iterated over it by making little adjustments. Changes to the bar order and the addition of grouped count plots served as our first styling lesson for the plot. From there, you discovered how to use colour to decorate the plot, including conditionally colouring bars. You then discovered how to further alter the graph by including value lab.
Source Code Snippet
Output:
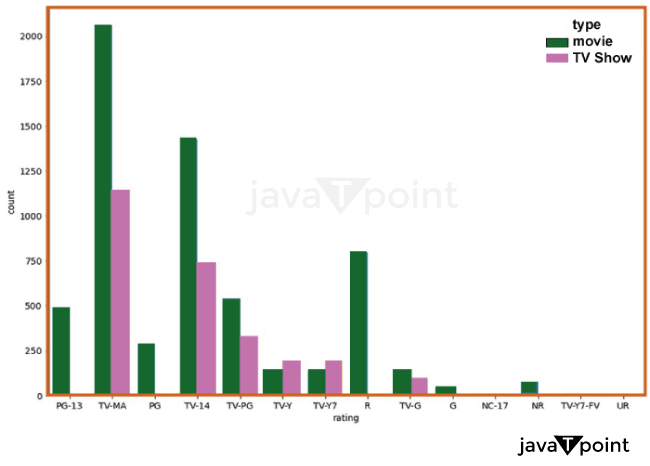
Explanation: A count plot of the 'rating' column of the 'df1' InfoFrame with the color adjusted to the 'kind' column makes up the third output. This chart displays the frequency of each distinct value in the "rating" column, split down by the kind of material (a movie or TELEVISION show, for example). We can observe how the film rating distribution and TELEVISION series vary thanks to this plot. We can observe that while the rating PG-13 is more prevalent in films than in the TELEVISION series, TELEVISION shows are more likely to receive the TELEVISION-MA classification.
Source Code Snippet
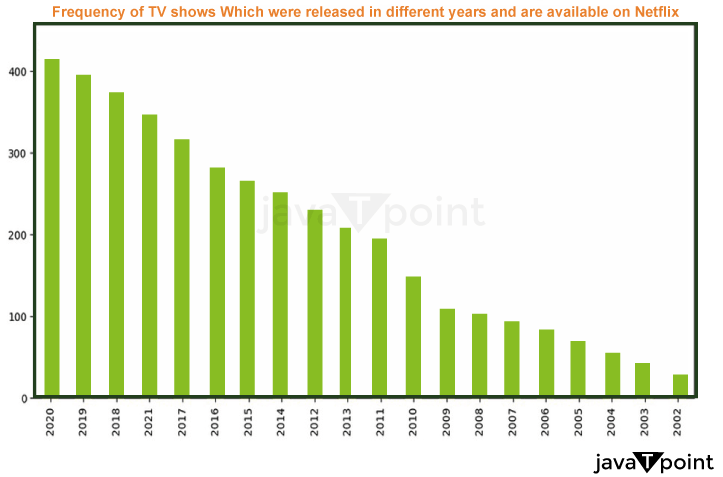
Output:
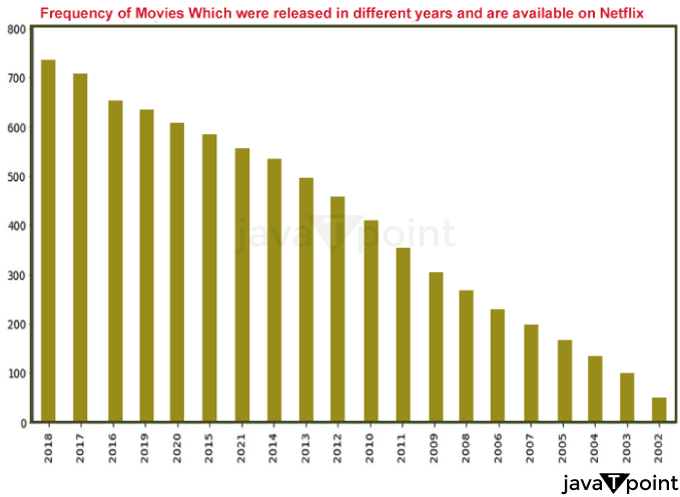
Explanation: The frequency of films released in different years and made available on Netflix is displayed in this bar graph. With the count of Films for each year displayed on the y-axis, the graphic displays the 20 most frequent years for Films in the information set. "Frequency of Films which were Released in Various Years and are Accessible on Netflix" is the storyline's title, highlighted in red. while comparing the data set while one variable is changing, several bar graphs are employed. It is simple to transform it into a stacked region bar chart, in which each subgroup is shown one on the top of the other. By changing the bars' positions and thickness, it may be plotted.
Source Code Snippet
Output:
Like the output above, this one displays the frequency of the TELEVISION series released over time and available on Netflix.
Source Code Snippet
Output:
Source Code Snippet
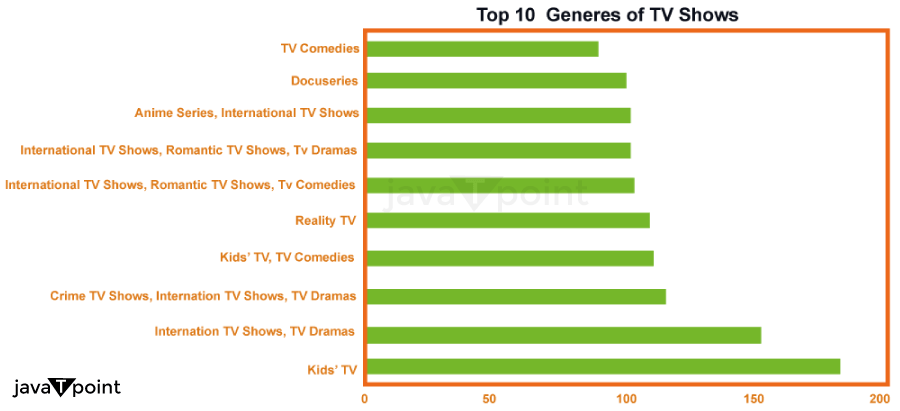
Output:
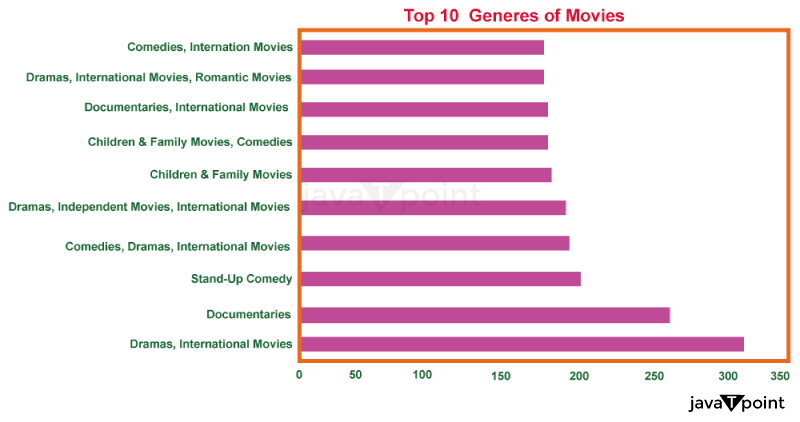
These horizontal bar charts display the top 10 movies and television program categories.
Consolidated Code for Netflix Data Analysis using Python
Output:
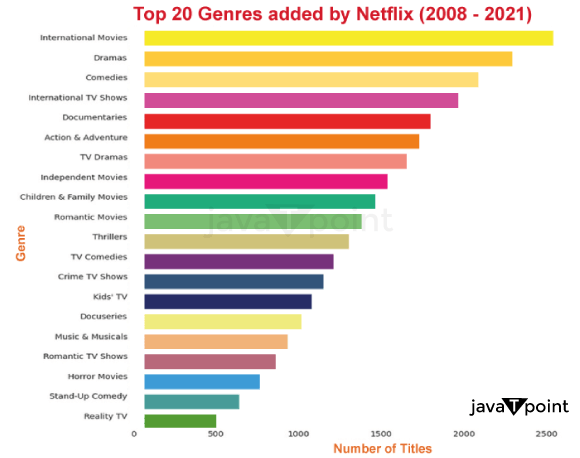
Explanation: We can observe from the first plot how frequently Netflix introduced new material between 2018 and 2020. According to the plot, there has been a yearly growth in the number of titles added, with a noticeable increase in 2015. The annual addition of films has typically outpaced that of TELEVISION episodes.
The top 20 categories that Netflix added between 2018 and 2020 may be seen in the second plot. The plot demonstrates that "International Films" are the most popular genre, followed by "Dramas" and "Comedies". Additionally, a handful of TELEVISION program categories made the top 20 list, with the majority being the movie category. This means that Netflix has prioritized introducing films to its platform more than the TELEVISION series.
Further Analysis
Leading 5 Directors: The code identifies the top 5 filmmakers with the most films. Rajiv Chilaka, Ral Campos, Suhas Kadav, Jan Suter, and Marcus Raboy are on the list.
| director | counts | |
| 4019 | Rajiv Chilaka | 22 |
| 4066 | Ra?l Campos | 18 |
| 261 | Jan Suter | 18 |
| 4650 | Suhas Kadav | 16 |
| 3233 | Marcus Raboy | 16 |
Top 5 Actors: The code also identifies the top 5 actors with the most films. Rupa Bhimani, Anupam Kher, Julie Tejwani, Takahiro Sakurai, and Om Puri are on the list.
| cast | counts | |
| 2605 | Anupam Kher | 39 |
| 26903 | Rupa Bhimani | 31 |
| 30263 | Takahiro Sakurai | 30 |
| 15518 | Julie Tejwani | 28 |
| 23591 | Om Puri | 27 |
Top 5 TELEVISION Shows by Number of Climates: The code lists the top 5 TELEVISION shown by some climates. The information set contains information on the name, runtime, kind, and number of climates. The TELEVISION program with the most climates has 16, as can be seen.
| No. | title | kind | no__of__climates |
| 548 | Grey's Anatomy | TELEVISION Show | 17 |
| 2423 | Supernatural | TELEVISION Show | 15 |
| 4798 | NCIS | TELEVISION Show | 15 |
| 4220 | COMEDIANS of the world | TELEVISION Show | td13 |
| 1354 | Heartland | TELEVISION Show | 13 |
Conclusion
In conclusion, we learned much about Netflix content using Python and various info analysis modules. The decisions Netflix makes about the material it adds to its platform and how it markets it to its viewers can be improved with the aid of this Info. Any industry may benefit from the insights and decisions gained through info analysis since it is such a potent instrument. Using Python and statistical tools, we can better grasp any information set and make info-driven decisions.
 For Videos Join Our Youtube Channel: Join Now
Feedback
- Send your Feedback to [email protected]
Help Others, Please Share


