Python Tutorial
Python OOPs
Python MySQL
Python MongoDB
Python SQLite
Python Questions
Plotly
Python Tkinter (GUI)
Python Web Blocker
Python MCQ
Related Tutorials
Python Programs
How to Set X-Axis Values in Matplotlib in PythonMatplotlib is a Python library that is utilized frequently with Jupyter Notebook. The module in matplotlib that is utilized is called pyplot. In this instructional exercise, we'll become familiar with a smidgen about matplotlib and how to involve it in Jupyter Note pad. Matplotlib.pyplot gives a MATLAB-like approach to plotting. This implies that pyplot has many capabilities to make changes to a figure. Matplotlib in blend with Jupyter Notebook is a famous method for envisioning information involving Python for a wide range of utilizations in science, innovation, and training. After the installation is completed. We should begin utilizing Matplotlib with Jupyter Notebook. We will plot different charts in the Jupyter Note pad utilizing Matplotlib. We can set the X-axis values in Matplotlib using Python by importing the pyplot module from the Matplotlib library. The pyplot module will provide a function called xticks() using this function we can set the values of the x-axis. Syntax: The xticks() function will be used to set the X-axis values and it accepts the following parameters: Ticks:
Labels:
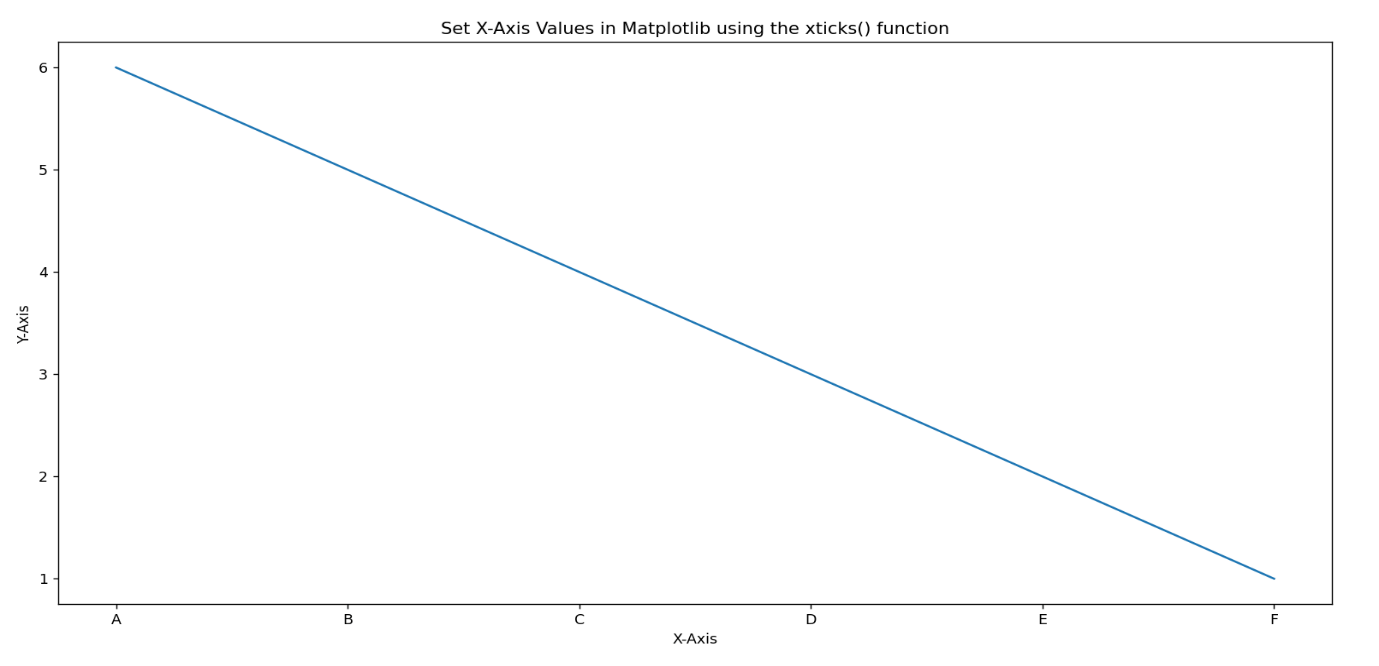
**kwargs Text properties used to control the presence of names. Returns: xticks() capability returns following qualities: locs: Rundown of xticks area. labels: Rundown of xlabel text area. Example 1: In this model, we will set up the X-Pivot Values in Matplotlib utilizing the xtick() capability in the python programming language. Output: 
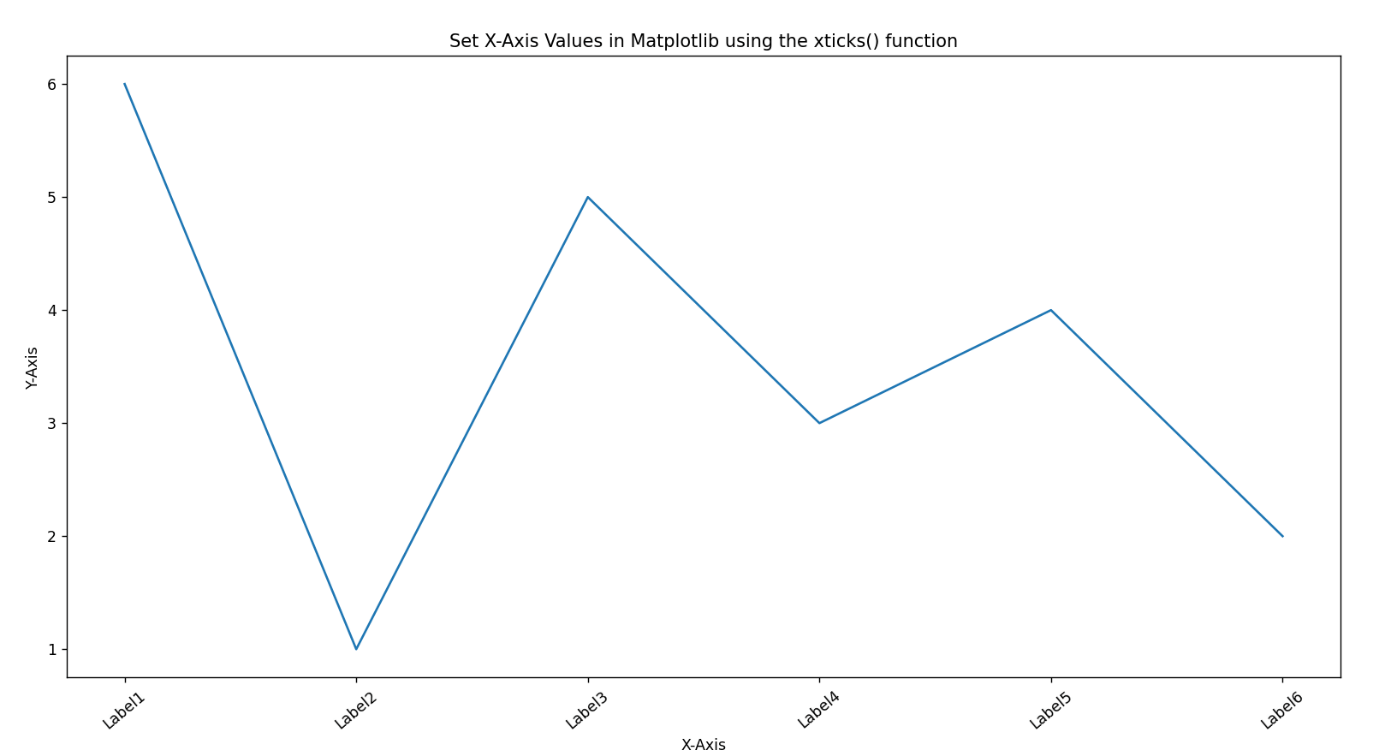
Example 2: In this model, we will involve the revolution contention to acknowledge turn esteem in degree and it will pivot names in the clockwise bearing by determined degree. Output: 
|
 For Videos Join Our Youtube Channel: Join Now
Feedback
- Send your Feedback to [email protected]
Help Others, Please Share


