| |

Dependency GraphIntroduction to Dependency GraphsIn the field of data management and analysis, it is crucial to comprehend and visualise intricate relationships between multiple elements. Dependency graphs offer an effective solution to achieve this goal. Dependency graphs are data structures that consist of nodes and edges. In these graphs, nodes represent different elements, while edges define the dependencies or relationships between these elements. Think of it as a roadmap of connections in data. The Significance of Dependency GraphsThey offer a clear and concise way to represent intricate dependencies, which can be incredibly valuable in various domains. From software development to system administration, dependency graphs help us prevent errors, optimise processes, and enhance efficiency. Types of Dependency GraphsDependency graphs come in assorted flavours, each serving a specific purpose. Let us take a closer look at them:
Visual representations called directed dependency graphs depict how nodes are interconnected and dependent on each other. In these graphs, changes made to a parent node impact its child nodes, but not vice versa. Influence flows in only one direction, like a one-way street. This type of graph is widely used in many fields, including computer science, engineering, and project management, to enhance the visualisation of complex systems and their dependencies. 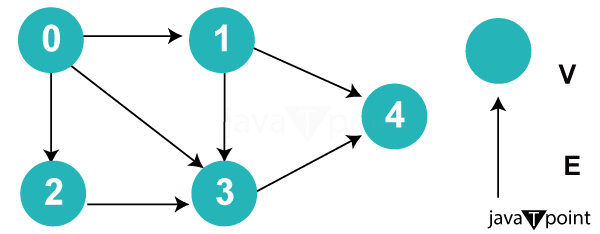
Undirected dependency graphs are a type of graph that represents relationships between nodes without a specific direction. This means that changes in one node do not necessarily affect another, making them ideal for modelling symmetric relationships. It's like a mutual friendship where both parties are equal, and changes in one friend do not automatically affect the other. So, undirected graphs are useful when the relationship between nodes is not dependent on a specific direction. 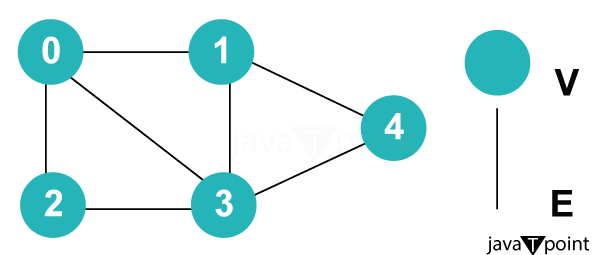
Acyclic dependency graphs are a type of graph in which there are no cycles or loops. This means that the graph flows in a single direction without any paths that lead back to a previous node. This property is essential for ensuring that data analysis processes are completed successfully without getting stuck in an infinite loop. By using acyclic dependency graphs, we can design efficient and reliable data analysis pipelines that are free of circular dependencies. 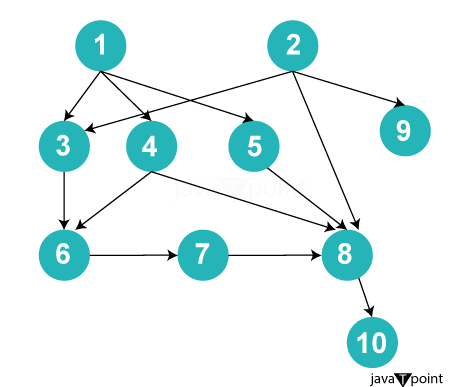
Creating a Dependency GraphNow that we understand the significance and types of dependency graphs, how do we create one? It is a two-step process:
Creating a dependency graph begins with identifying dependencies between elements. This often involves analysing the logic of a system or dataset. It is like connecting the dots in a complex puzzle.
To bring your dependency graph to life, you will need visualisation tools. Popular options include Gephi, D3.js, and NetworkX for Python. These tools help you transform raw data into a visual representation of relationships. Overcoming ChallengesWhile dependency graphs are powerful, they come with their set of challenges:
Cyclic dependencies occur when there is a loop in the graph. These can lead to errors and make systems harder to understand. Think of it as a never-ending loop that can cause confusion.
In large systems, managing and visualising complex dependency graphs can be challenging. Strategies for scalability are essential to ensure that your graph remains manageable even as it grows. Advantages of Using Dependency GraphsThe advantages offered by Dependency Graphs are:
Real-World ApplicationsDependency graphs cannot be limited to the digital domain as they have actual applications in various fields. Let us explore its examples:
In project management, dependency graphs are incredibly useful for identifying task dependencies and critical paths. They help project managers plan and execute tasks efficiently.
When it comes to understanding social networks and relationships between individuals, dependency graphs can help uncover underlying patterns and connections.
In biological research, dependency graphs aid in mapping out the complex web of biological processes and interactions within living organisms. They can be a meaningful change in understanding complex biological systems.
Next TopicDiameter of an N-ary tree
|
 For Videos Join Our Youtube Channel: Join Now
Feedback
- Send your Feedback to [email protected]
Help Others, Please Share


