| |

Line GraphWhat Is It?A line connects an individual data point in a line graph, also referred to as a line plot or a line chart. Line graphs are frequently used in finance to show the historical price movement of an asset or instrument. Comparing line graphs to other data visualizations such as bar charts, pie charts, and (especially trading) candlestick charts is possible. Highlighting abnormalities inside and between data sets is useful. 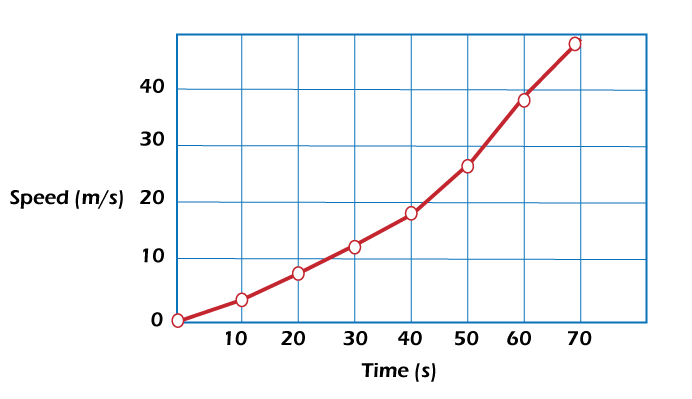
The world of today is increasingly information-focused. Every aspect of our life makes use of data in some way. Data are best presented methodically using a tabular representation. In the following sections, let's go into greater detail regarding line graphs. Key Lessons
Recognizing Line GraphsStraight lines connect the "markers" for the data points in line graphs. Visualization is aided by the straight lines connecting these data points. Although line graphs are used in various industries and for various reasons, they are particularly useful when creating a graphical representation of changes in values over time. Investors often use line graphs to display patterns to better understand their investing studies, particularly in the context of technical analysis. Line graphs are frequently used in the financial industry to produce visual representations of values over time, including variations in security prices, financial statements from businesses, and histories of significant stock indices. They help compare various securities as well. Building a Line GraphBecause the values of the y-axis rely on those of the x-axis, y-axis is known as the dependent axis. We should use the data measured along each axis to designate each axis. The x-axis would reflect the time measured (trading days within the period), while the y-axis would show stock prices, for instance, if the change in a stock's price over the past two weeks were being measured. After that, each axis must be divided into the proper increments (e.g., day one, day two, etc.). The stock's closing price is the most typical data point utilized when utilizing line graphs to track the price of a stock. 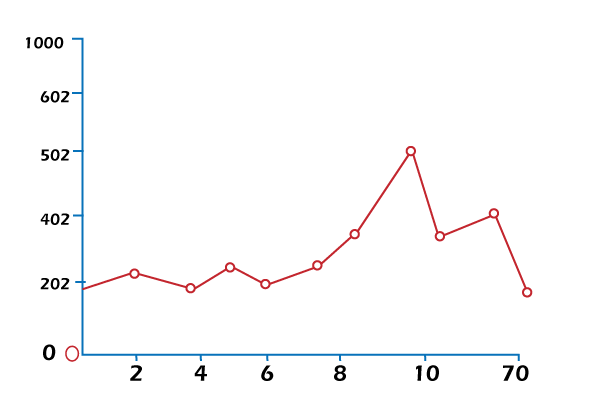
Consider the scenario where a given stock's price was $30 on the first day of trading, producing a data point at (1, $30). The stock's price on day two of trading was $35, yielding a data point at (2, $35). A line connecting each data point on the plot illustrates how the values have changed over time. The line would incline upward and to the right, if the stock's value rose daily. In contrast, the line would slant rightward and downward if the stock price continually fell. Various Line Graph TypesLine graphs come in three main varieties. While each type is fundamentally based on the same principles, each has a certain circumstance that works best. Basic Line GraphThe simplest kind of line graph is a simple one. Since only one dependent variable is being monitored in this graph, just one line joins all the data points. The graph's sole function is to chart the changes in that variable over time, and all of the points pertain to the same thing. Since just one variable is tracked, it is impossible to compare it to another variable using this graph. The x-axis in the example below represents time, and the y-axis represents the change in earnings for the consumer items in the United States from one year to the next. Since it only examines one set of data (all goods), there is only one line in this graph of the Consumer Price Index, which displays the annual inflation rate. 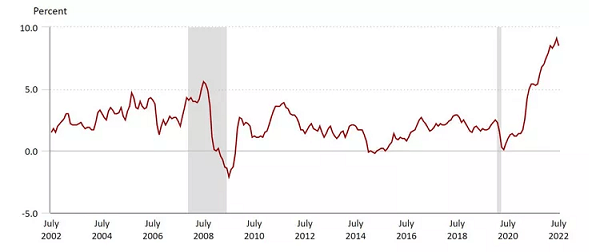
Numerous Line GraphA multiple-line graph compares numerous dependent variables to a single independent variable by charting them on the graph (often time). To distinguish between each data set, various dependent variables frequently receive different coloured lines. Lines do not cross between dependent variables; each line corresponds to only the points in its specific data set. As an illustration, the line graph below displays the Consumer Price Index. On the other hand, this graph depicts the change in price for three distinct categories: healthcare (red), goods (green), and housing (blue). This graph shows that in July 2022, the price growth for commodities was larger than that for the other two categories. Over the past ten years, however, the categories that frequently had greater inflation rates were those that paid for housing or healthcare. 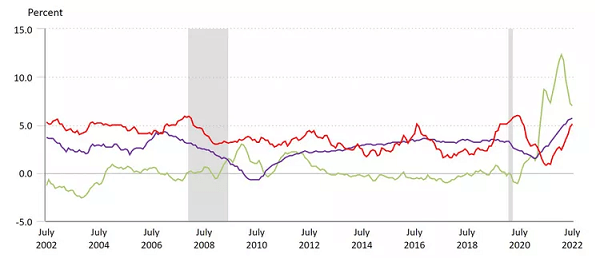
Graph of Compound LinesSimilar to a multiple-line graph, a compound line graph uses numerous variables. However, the variables are frequently piled on top to display the overall quantity across all variables. This explains to consumers how each variable is related to the others and how the sum changes. 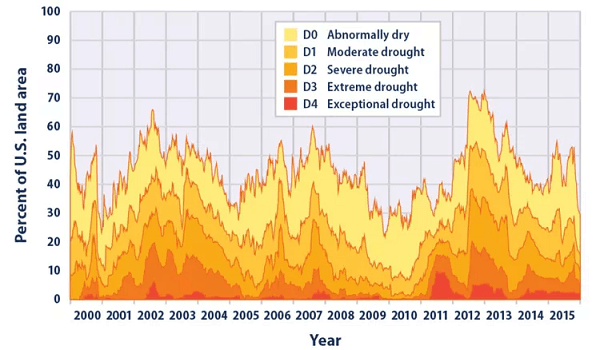
There are five dependent variables in the Environmental Protection Agency's (EPA) example below, which vary from unusually dry land areas to extreme drought locations. The statistics for the worst drought were plotted first, giving the spot beneath it was given a dark red shading. Following that, more sets of data were plotted, and they tinted the blank space beneath each of those lines with the corresponding hue. This illustrates the relationship between descriptions of droughts and the overall percentage of U.S. land area that falls into each category by year. Line graph components can differ depending on optional features or formatting. The best line graphs are those that are the simplest to comprehend and contain the following features:
Parts in a Line GraphLegendEach dependent variable's definition and how to distinguish between various data sets are described in the legend. Each dependent variable in the above example is designated with a different colour. DataThis is the data on your graph. It is the thing that makes the dots on your chart join to produce the lines. Every data point on a line graph connects the dependent variable to an independent variable by citing a distinct source. As was seen above, certain examples may merge various data sets into a single graph. Companies may have specialized data integrity analysts or equivalent positions to monitor database activities to guarantee that data is secure and accurate. X-AxisThe set of data along the line graph's flat, the horizontal bottom is known as the x-axis. Most line graphs have an x-axis related to time, whether the number of days in a month or year, the number of weeks since a product launch, or the various months in a year. Y-AxisThe collection of data that runs vertically down the graph's left side is known as the y-axis. This data collection is displayed on the right in some line graph iterations. These numbers, in any event, count the things being measured. The graph may begin at zero, yet there are some situations when starting higher makes more sense. The line comes last on the list. The line represents a single dependent variable's entire set of data points. The arc of this line depicts the change in information over time. As long as all data sets are measured across comparable periods, we may compare them to other lines. Even if it is extremely simplistic, this line might inform management of the steps that need to be followed to enhance operations or strategic planning. Want to display many data sets and any one of the data sets might work better as a bar chart? Combination charts can be created using apps like Excel, and Google Sheets, where one dependent variable is displayed as a bar graph and another dependent variable is displayed as an overlaying line graph. 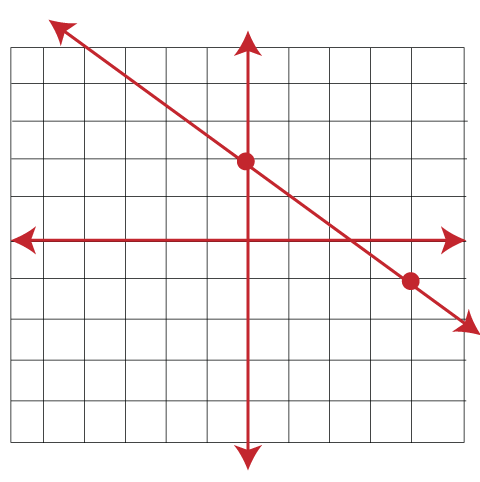
Excel Line Graph CreationIn Excel, a line graph may show patterns over time. (Before drawing the line graph, leave cell A1 empty if you use numeric labels.) The steps to making a line graph in Excel are listed below.
Uses of a Line GraphA line graph is no different from other data visualization tools because it best suits a particular task. An ideal line graph depends on the underlying data and includes the following:
Line Graph BenefitsThe following are some benefits of using line graphs:
Line Graph DrawbacksThe use of line graphs has the following drawbacks:

Some of the Frequently Asked Questions:What Purpose Does a Line Graph Serve? Line graphs are used to visualize changes over various periods. What Is the Purpose of a Line Graph in Finance? Because they are so good at visualizing trends over time, line graphs are useful in the banking industry. Because of this, they are frequently used to show how a stock is doing over a certain period. What Kinds of Line Graphs Are There? Every type of graph has a different number of dependent variables and a different way the user wants to show how these variables relate to one another. What Constitutes a Line Graph? Line graphs can be very flexible regarding the title, labels, markers, line style, and other ancillary aspects. The x-axis (independent variable), y-axis (amount of dependent variable), and input data are nevertheless required for all line graphs (dependent variables). Each dependent variable's data points are indicated on the graph and are connected by a line. How to Read a Line Graph To read and comprehend a line graph, take into account the stages listed below:
Next TopicSymmetric Binary Tree
|
 For Videos Join Our Youtube Channel: Join Now
Feedback
- Send your Feedback to [email protected]
Help Others, Please Share


