| |

Excel FeaturesWhat is MS Excel?MS Excel is a spreadsheet that is developed by Microsoft for Windows, macOS, Android, and iOS. The features include in MS Excel are pivot tables, graphing tools, and a macro programming language called Visual Basic for Application (VBA). MS Excel is the most widely used Microsoft Office application. MS Excel is a spreadsheet program for storing and analysing numerical data. In other terms, MS Excel is a spreadsheet tool that allows anyone to enter data into tables. With the help of the Excel spreadsheet, we can analyse the data easily. The image below shows how an Excel spreadsheet appears: 
It is a spreadsheet program with several columns and rows, where each intersection of a column and row is referred to as a "cell." Each cell includes a single piece of data or information. We may make information easier to access and automatically draw information from changing data by organizing the data in this way. Features of MS ExcelThe following are the features of MS Excel: 1. Graphical Features of ExcelExcel offers a lot of graphical features for presenting data in graphs and pictures:
2. Functional Features of ExcelExcel Tools and Features assist us in performing complex calculations and enhancing the Excel application's features.
3. Database Feature of ExcelExcel may be used to create databases and carry out a variety of data processing operations.
Features of Excel 2007The following are the features of Excel 2007:
Features of Excel 2010Slicers and Sparklines are two of Excel 2010's most essential new features:
Features of Excel 2013Excel was known as MDI (Multiple Document Interface) until 2010, but it is now known as SDA (Single Document Application). Excel 2013 boasts a more polished and modern appearance along with many more performance features.
Features of Excel 2016The appearance of Excel 2016 is identical to that of Excel 2013.
Top 10 Features of Excel 2019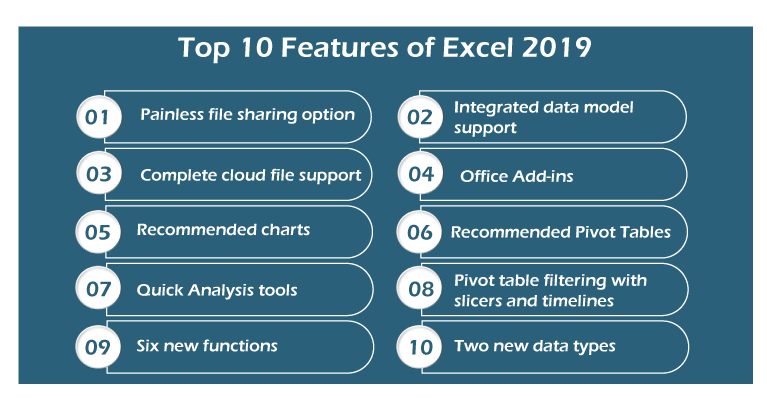
Below are the top 10 features of Excel 2019:
1. Painless File Sharing OptionsUsing Excel 2019 to share files and co-author spreadsheets with co-workers has been easier or more convenient. In the worksheet view, the Share button is located on the right side of the row with Ribbon tabs, making it easier than ever to share our Excel online. We cannot only invite others to view and edit workbooks which are saved on our OneDrive in the cloud, but we can also present them in online Skype sessions and share them on social media websites. 2. Integrated Data ModelExcel 2019 allows us to construct genuine one-to-one and one-to-many relationships between data tables imported from standalone database management tools and data lists created in Excel. The relationships between the data tables and lists in the Data Model allow us to use the data from any of their columns in the Excel pivot tables and charts which we generate. 3. Complete Cloud File RecordThe Excel Save (File→Save) and open (File→Open) screens make it simple to save and update our favourite worksheets on our OneDrive or Company's SharePoint team site. When we save a workbook file to the cloud manually, Excel's new AutoSave Function saves all of our editing changes to the workbook file as we work. We can then open a Version History task pane by clicking the new Version History button (to the right of the Share button on the row with the Ribbon tabs) to see all the previously saved versions of the file, which we can copy or restore.
4. Office Add-insOffice Add-ins allow us to extend the capabilities of Excel 2019 by allowing us to install a variety of specialized little programs (also called apps), which are available from the Office Store directly within the program. 5.Recommended ChartsNot sure which form of the chart will best display our data? Simply place the cell pointer anywhere in the data table, select Insert→Recommended Charts from the Ribbon. The Insert Chart dialog box appears, with a Live Preview showing how the table's data will appear in several types of charts. Once we have found the chart that best displays the data, we simply click on the OK button to embed the chart in the table's worksheet. 6. Recommended Pivot TablesIf we are a novice creating pivot tables for Excel data lists and data tables imported from standalone database management tools, Excel can now recommend and generate one for us. Simply we need to locate the cell cursor in one of the data list's cells, and select Insert→Tables→Recommended PivotTables on the Ribbon. Excel 2019 then opens the Recommended PivotTables dialog box appears, displaying a list of different pivot tables, which we can build on a new worksheet in the current Excel workbook by pressing the OK button. 7. Quick Analysis ToolIn Excel 2019 worksheet, the Quick Analysis tool displays in the lower-right corner of any selected table. Applying conditional formatting, producing a chart or pivot table, adding the values in rows or columns or sparklines for the data in the selected table are the possibilities available with this tool. And thanks to Excel's Live Preview feature, we can see how our table data would seem using the several options before we apply any of them. 8. Pivot Table Filtering with Slicers and TimelinesSlicers in Excel 2019 allow us to easily filter data in our pivot tables across several columns using onscreen graphic objects. We can use a timeline to graphically filter pivot table data based any date type in the Data Model. 9. Six New FunctionsExcel 2019 has six new functions that many users will like. The six new functions in Excel 2019 are as follows.
10. Two New Data TypesStock and Geography are two new data types in Excel 2019 which we can use to link data from the internet to our spreadsheets. We can link selected aspects of data related to the company into our spreadsheets to help with reporting and analysis. We may also use Geography data types to link demographic and other data about cities and states in our spreadsheets. Stock, and Geography data type, offer easy and fast access to data that many business professionals need to include in their spreadsheets without having to spend time looking for it or manually entering it. As a result, these two new data types should make working with Excel more efficient and precise.
Next TopicFlash Fill in Excel
|
 For Videos Join Our Youtube Channel: Join Now
Feedback
- Send your Feedback to [email protected]
Help Others, Please Share


