| |

How to Calculate Standard Deviation in ExcelExcel is used extensively for statistics and data analysis. Standard deviation is something that is used quite often in statistical calculations. What is Standard Deviation?Standard deviation is a measure of how much variance there is in a set of numbers than the average (mean) of the numbers. The purpose of the standard deviation is to help you understand if the mean returns "typical" data. The closer the standard deviation is to zero, the lower the data variability and the more reliable the mean is. The standard deviation equal to 0 indicates that every value in the dataset is equal to the mean. The higher the standard deviation, the more variation there is in the data and the less accurate the mean is. To calculate standard deviation in Excel, you can use one of two primary functions, depending on the data set. Both functions are fully automatic.
Calculating Standard Deviation in ExcelIt is easy to calculate the standard deviation. You need to know which formula to use in Excel. There are six standard deviation formulas in Excel. And if you consider database functions, then there are eight standard deviation formulas. 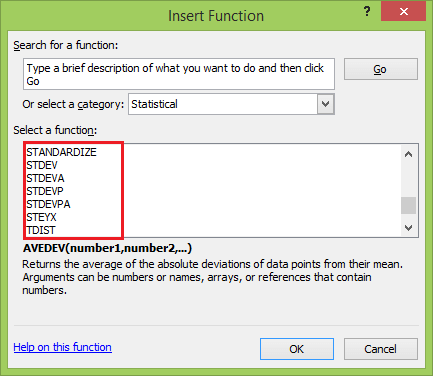
These six formulas can be divided into two groups:
In almost all of the cases, you will use standard deviation for a sample. You use the term 'population' when considering all the datasets in the entire population. On the other hand, using the term 'sample' when using a population is impossible or unrealistic. In such a case, you pick a sample from the population. You can use the sample data to calculate the standard deviation and infer for the entire population. Now let's understand these three formulas:
So, you can safely assume that in most of the cases, you would have to use the STDEV.S function or STDEV function if you're using Excel 2007 or prior versions. By Using the STDEV.S FunctionSTDEV.S uses numerical values and ignores logical values and text in the sample. Syntax Here is the syntax of the STDEV.S function given in Excel:
Example Now, let's take a simple example of calculating the standard deviation by using the STDEV.S function. Step 1: Consider the following student's marks data set, as shown below: 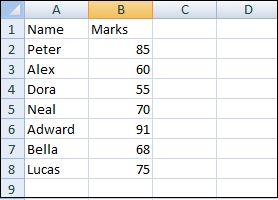
Step 2: First, calculate the Average as follows. 
Step 3: Use the following formula to calculate the standard deviation by using the above data set. NOTE: If you're using Excel 2007 or prior versions, you will not have the STDEV.S function. In that case, you can use the below formula:Step 4: Enter the =B2:B8 formula in the formula bar of the excel sheet. 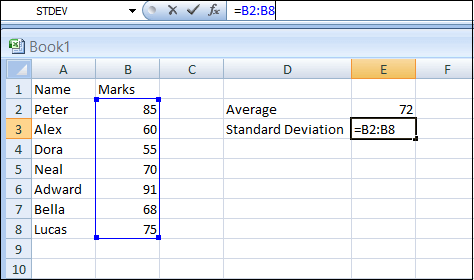
Step 5: Now select the STDEV function, and you will get the following function arguments box. 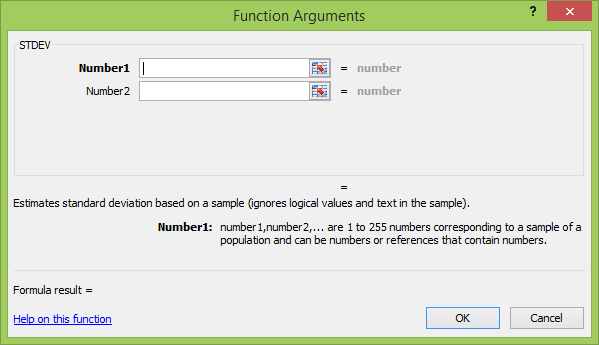
Step 6: Enter the values in the number of boxes as follows and click the OK button. 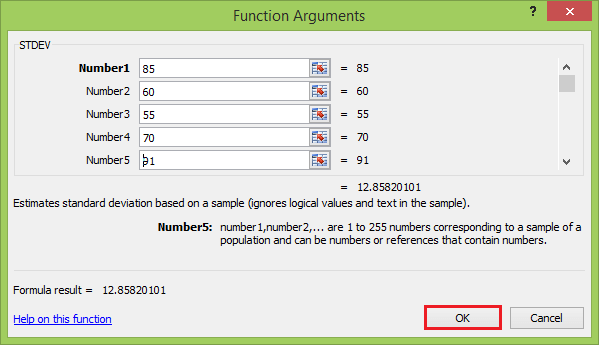
Step 7: You will get the result value in the E3 cell. 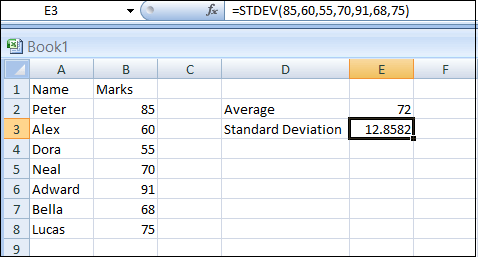
The above formula returns the value of 12.8582, which indicates that most of the students in the class would be within the score range 72-12.8582 and 72+12.8582. This is a very small sample set. In reality, you may have to do this for a bigger sample data set where you can observe normal distribution better. By Using the STDEV.P FunctionYou may notice that Excel contains older functions, STDEVP and STDEV, which also calculate the standard deviation. In short:
Although STDEVP and STDEV still exist for backward compatibility, Microsoft recommends that people use the newer STDEV.P and STDEV.S functions instead. STDEVP function calculates standard deviation based on the entire population given as arguments. This function ignores logical values and text. Syntax Here is the syntax of the STDEVP function given in Excel:
Example Let's take the same example where we calculate the population standard deviation by using the STDEVP function. Just follow the same steps as above. Step 1: Create the student marks data set and calculate the average also as follows. 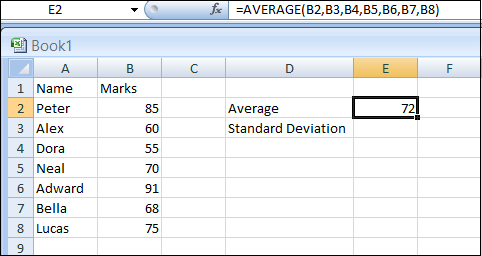
Step 2: Use the following formula to calculate the population standard deviation using the above data set. Step 3: Enter the =B2:B8 formula in the formula bar of the excel sheet. 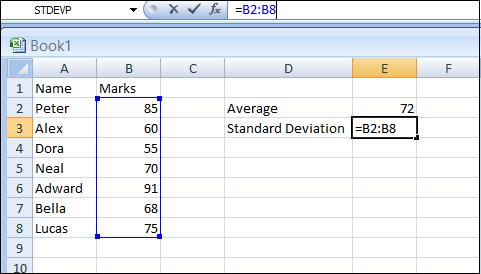
Step 4: Chose the STDEVP function and Function Arguments box appears. 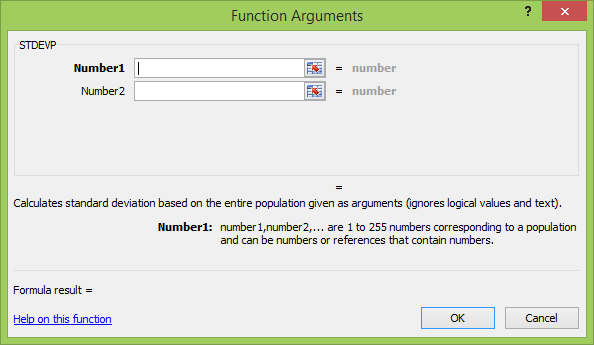
Step 5: Enter the values and click the OK button. 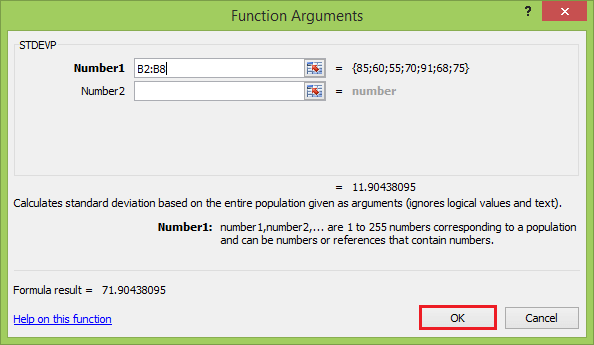
Step 6: Now, you will get the result value in the E3 cell. 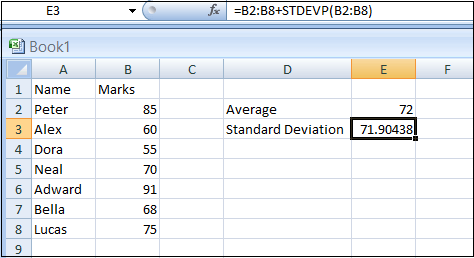
The above formula returns the value of 71.9. The sample standard deviation will always be smaller than the population standard deviation when calculated for the same dataset. This is because the sample standard deviation formula has to consider more variation in the true population than measured in the sample. These examples show the quick method of calculating standard deviations using a cell range. You can also write out each of the commands in a longer format with the individual marks entered. For example, entering =STDEVP(B2:B8) produces an identical result. However, if one column B values were incorrect and adjusted, the cell range method would automatically update the standard deviation calculation. In contrast, the longer format will require manual adjustment of the command. |
 For Videos Join Our Youtube Channel: Join Now
Feedback
- Send your Feedback to [email protected]
Help Others, Please Share


