| |

Heap map in ExcelA heap map is a visual representation that shows a comparative view of the dataset. In MS Excel, conditional formatting is used for creating the heap map. By creating the heap map, the Excel users can easily spot the highest and lowest value in data. Different colors are assigned to the dataset when the heap map is created. These colors are assigned based on the values that reside in that dataset. Heap map has a default color scale, e.g., Green to Yellow to Red. Green color is for high value and red color for the lowest value. This chapter and topics will learn to create a simple heap map and dynamic heap map in an Excel sheet. What is a heap map?A heap map is a map using which you can highlight the comparative data. You can also create manually by providing the color codes to cells manually. But each time you have to change the color code when the value of the cell changes inside that heap map. It will be a long way to create a heap map for a set of data. Instead of manual heap creation, Excel users can use the conditional formatting feature to create a heap map and highlight the cells. Conditional formatting makes it easy to create a heap map and process after that. It means when the cell value changes, its color automatically changes according to its value. The most common color code is: the highest value is colored with green and the lowest value with red color. Create heap map in ExcelHeap map is a kind of data analysis tool using which you can analyze the data with the help of color-coding to cells. A heap map can be understood as it is a representation of data using color-coding. It is a graphical representation of data by assigning a different color to an individual cell. Three different ways are in this chapter by which you can create a heap map in an Excel sheet.
Create heap map manuallyA manual heap map requires smart work to assign the color-coding to the cells in an Excel sheet. It needs more effort to create a heap map manually. Every time you have to change the color code of the cell when you change the value or enter a new value to the cell. A heap map that is created manually can be called a static heap map. We have taken some data where we have provided the color-coding to the cells individually, one by one. 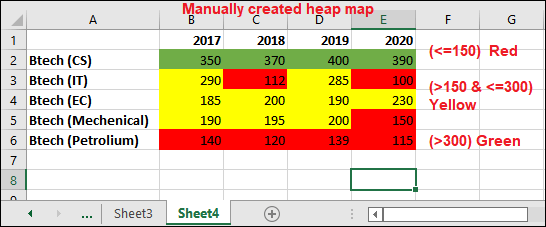
Excel users prefer to use conditional formatting that automates the process to change the color-coding of the cell on modifying the value of the cell. Conditional formatting is a better way to automate the process and time saving too. Heap map using conditional formattingConditional formatting is a perfect way to create a heap map for the Excel dataset. The color of the cell automatically changes when you alter the value of the cell. These are the steps to create a heap map using conditional formatting: Step 1: Following data for which we will create heap map. Now, select it to create a heap map for this data. 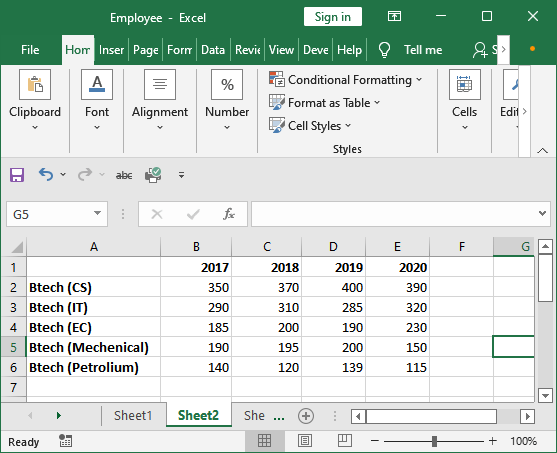
Step 2: Select the dataset (B2:E6) and click the Conditional Formatting dropdown option inside the Home tab in the Style group. 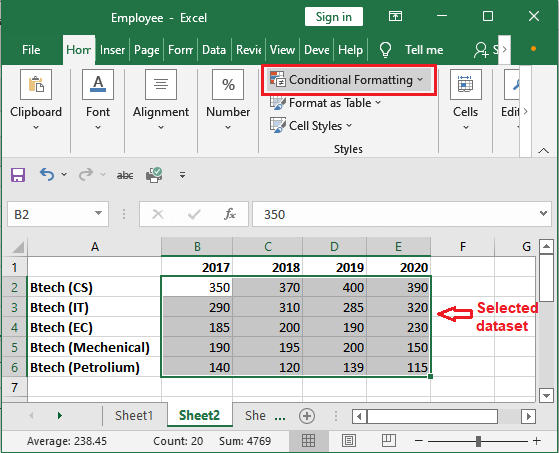
Step 3: In the Conditional Formatting dropdown list, click the Color Scale and choose one of the color gradients for the selected dataset. 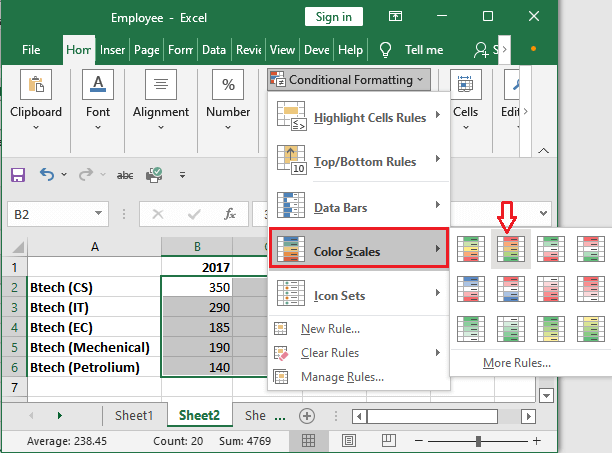
You will see various color combinations here. We have chosen the second one (Red - Yellow - Green). You can preview it by taking the mouse over the color scale. Step 4: See the heap map for the following data that has been created with the help of conditional formatting. Each cell having the different color. 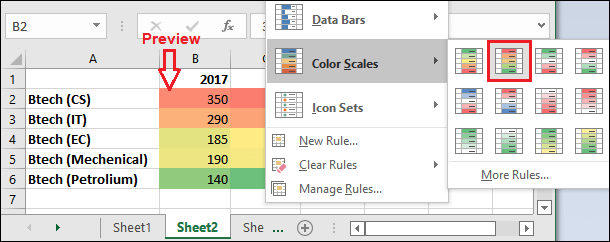
Here, you will see that 400 is the highest value in this dataset. Hence, the red color is assigned to it. In the same way, 200 is middle and 115 is the lowest. So, Yellow and Green are assigned. Other cell values have color accordingly matching with the nearest color scale. Note: If the value of any cells changes, it color-coding for the respective cell will automatically change. This one is the best example of heap map creation.Step 5: Here, you see that cell C3 has a value 310 to which light red color is assigned. Now, we will alter its value and look for the change of color for this cell. 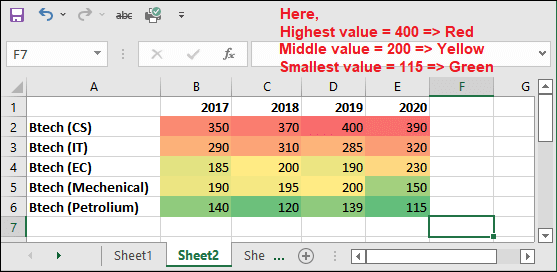
Step 6: You see that - we have changed the value from 310 to 112. Hence, the cell C3 color scale has been changed to green according to the cell value. 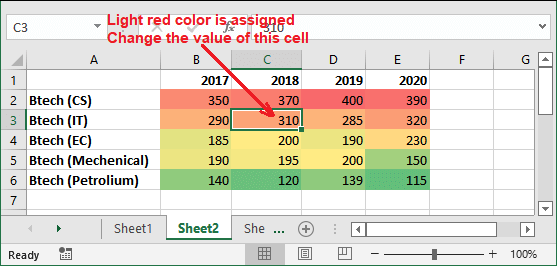
Fix the color scaleHere you see various colors, but all those color scales are similar to red, yellow, and green. It means different shades of these colors are assigned to the cells according to their values. If you do not want to show the different color shades and want to show only red, green, and yellow. For example, all values below 500 should be colored red. You can do it too. To implement this for your Excel dataset in your Excel sheet, follow the steps for it as given below: Step 1: In the Home tab, click the Conditional Formatting inside which choose Color Scale and then More Rules. 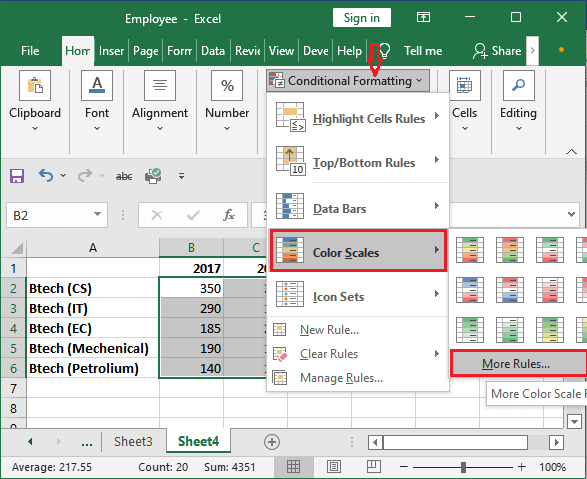
Step 2: A dialogue box for New Formatting Rule. Here, choose the 3-Color Scale for the Format Style dropdown list. 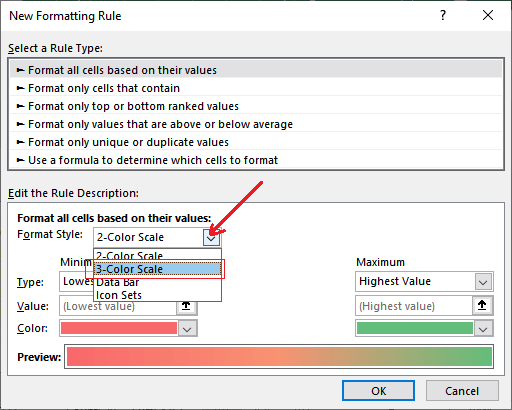
Step 3: Now, specify the minimum, midpoint, and maximum value in fields and assign the color for each as well whatever you want. Remember - also change the type to Number and click OK to close the dialogue box. 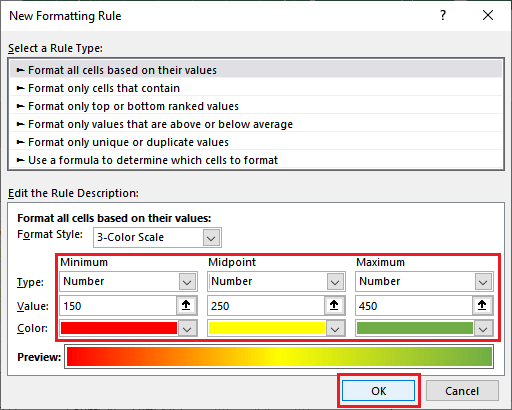
Step 4: You will now see that all the values have colors accordingly you have defined above. 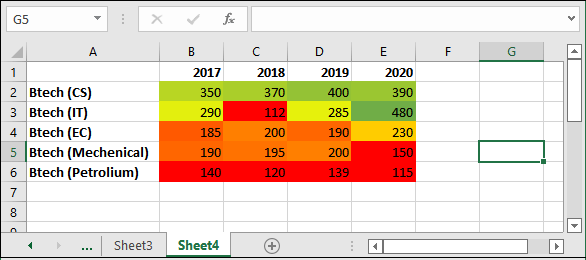
Caution: As you have already seen, conditional formatting is a wonderful tool for creating a heap map in Excel, but it's volatile. Here, volatile means that whenever the value of any cell inside the heap map changes, the conditional formatting recalculates every time. For a single or small change in dataset, the whole process for heap map recalculates, which makes the Excel file slow. It leads to the slow Excel workbook. In case you are working with a large dataset, it will lead to too much slow Excel workbook.Creating a dynamic heap mapConditional formatting is a way to create the heap map. Here you have seen that the conditional formatting is actually dependent on the cells values. Whenever any cell value changes inside the heap map, applied conditional formatting recalculates for the respective Excel sheet. This feature of conditional formatting allows the users to create a dynamic heap map. Dynamic heap is nothing, it is the same as we explained above but some advanced feature in the Excel sheet which makes the heap map dynamic. Let us look for the example of creating a dynamic heap map in an Excel sheet. We will explain the creation of a dynamic heap map using two different examples in which we will show you interactive control in Excel. Example 1: Heap map using Scroll barWe will use the same feature, i.e., conditional formatting to create the heap map with extra functionality. We will add on the scroll bar to create the dynamic heap map. When you will change the year using inserted scroll bar, the heap map changes as well. We will use a similar dataset as used in the above example so that you can differentiate how dynamic heap is different than normal heap creation. This type of dynamic heap is used in the dashboard and scroll bar over there when the screen size is not enough to show whole data at once. It may have space constraints. Step 1: Following is the dataset we have prepared in Sheet2 for this example. We will create a dynamic heap to show heap map for every two years. 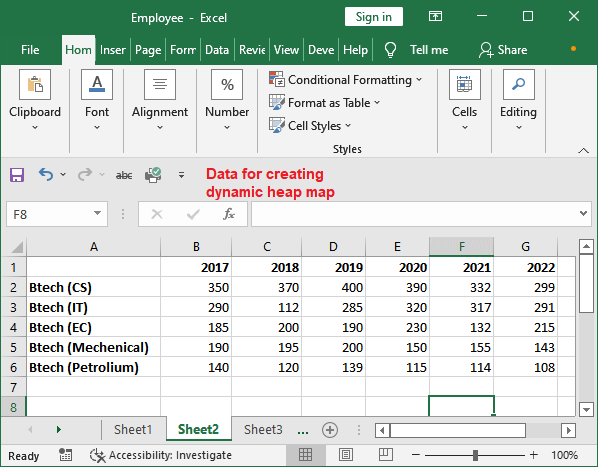
Step 2: Simply copy the course names of column A from Sheet2 using the Ctrl+C key. 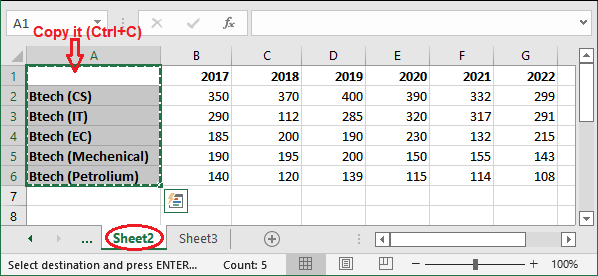
Step 3: Paste the copied data to a new sheet (Sheet3) in its first column. 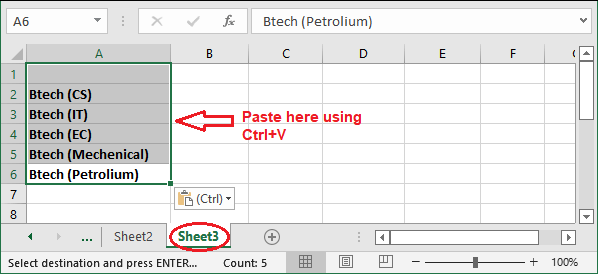
Step 4: Now, move to the Developer tab and click the Insert button and select the Scroll bar icon. 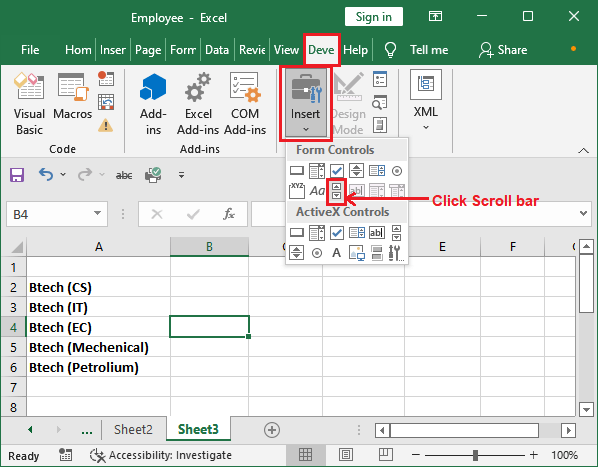
Step 5: Click anywhere on the sheet and a scroll bar will insert into this sheet. It is inserted vertically for now. 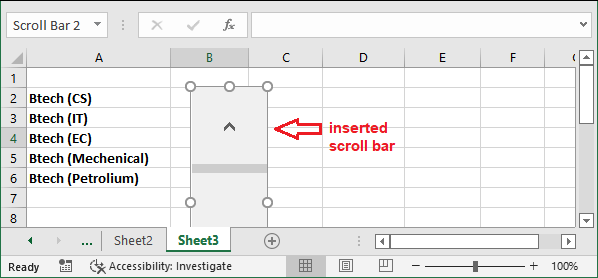
Step 6: Resize it by decreasing the width and increasing the height of the scroll. Now, it will look like a horizontal scroll bar. 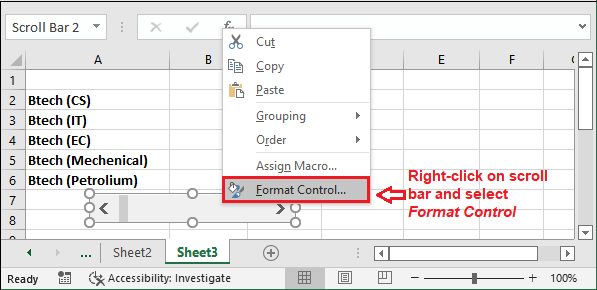
Step 7: A Format Control dialogue box will open where initially the value of the fields is as shown below inside the Control tab. 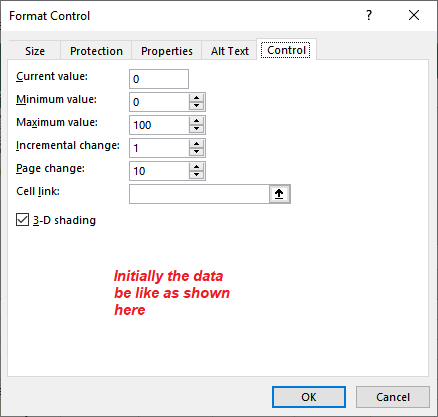
Step 8: Insert the values in all the given fields as shown below in the screenshot. Click the highlighted icon to insert a cell reference inside the Cell link field. 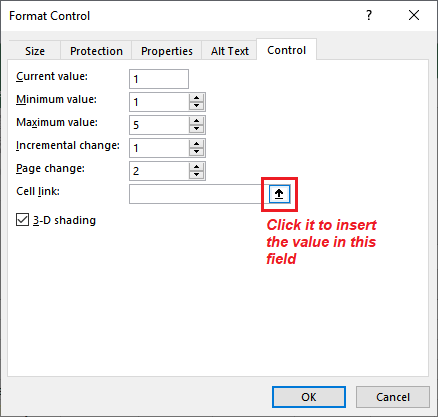
Step 9: Go to the previous sheet (Sheet2) and select a blank cell on this sheet. We have selected the I1 cell. 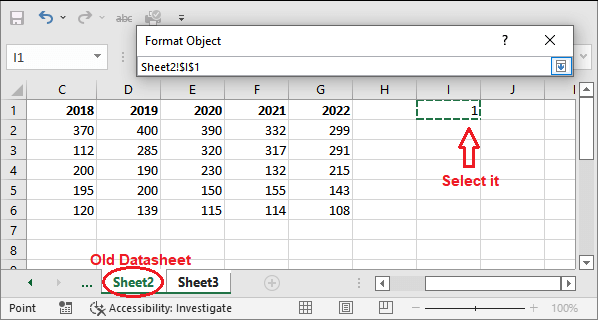
Here, 1 is automatically inserted into the I1 cell. Step 10: Now, see Cell link has the value. Click OK to close this dialogue box. 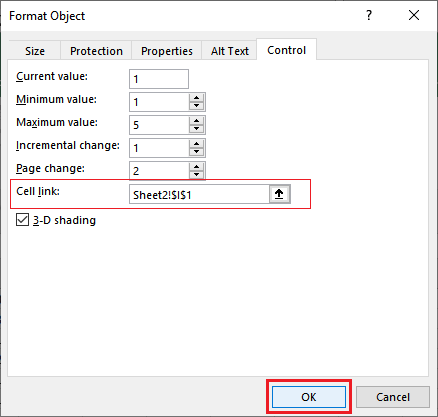
Fields on Format Object dialogue box
Step 11: Create an INDEX formula and enter it in the first B1 cell to get the value dynamically. Analyze and modify this formula for your data accordingly. =INDEX(Sheet2!$B$1:$G$6, ROW(),Sheet2!$I$1+COLUMNS(Sheet3!$B$1:B1)-1) 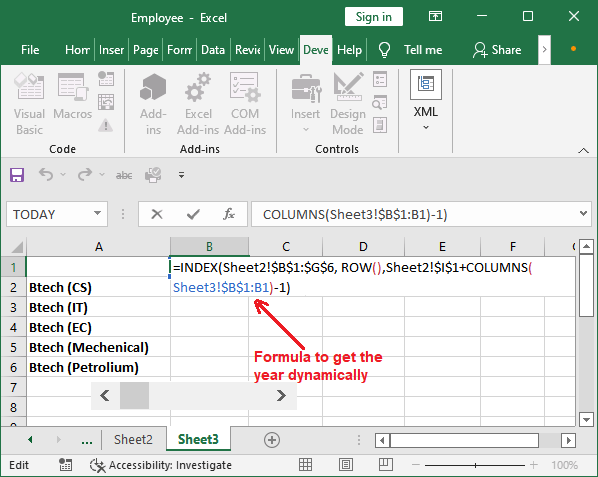
Step 12: Hit the Enter key and see that the value has been fetched dynamically, i.e., year 2017. 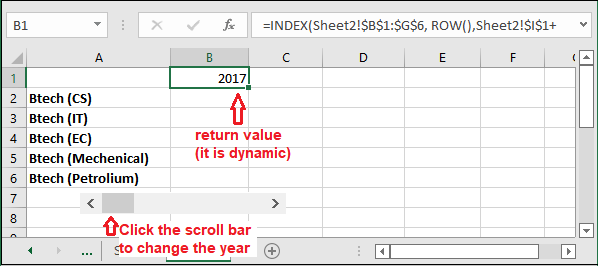
Now, if you click on the scroll bar, year will change inside this calculated B1 cell. Step 13: Drag the formula in below cell till row 6 to fetch data from the previous sheet (Sheet2). See the data placed below. Note: To drag the formula in any direction, select the formula resultant cell and take the cursor at the bottom right corner where an + sign will enable. Drag it to the direction where you copy the formula.Step 14: One more time, copy the formula to the right column (in column C). See fetched data from the Sheet2. 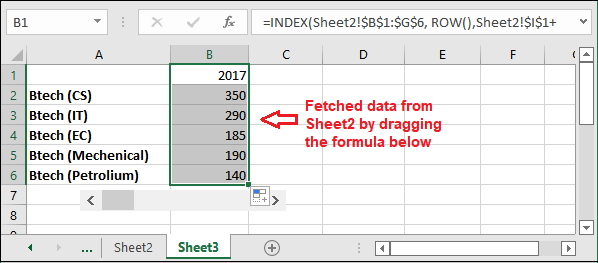
The dynamic data for the heap map is created inside Sheet3. Assign conditional formatting to dynamic data Assign the conditional formatting to the dynamic data created here. You have to follow the same steps you performed above. Step 15: Inside the Home tab, click the Conditional Formatting > Color Scales and then choose one of the color gradients. 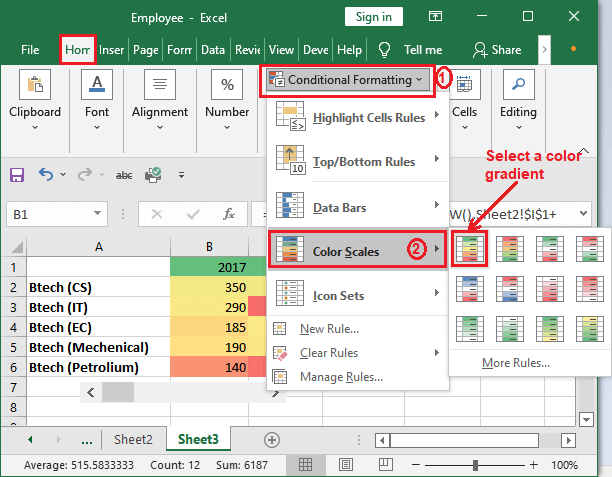
Step 16: See that the dynamic heap map is created completely. Now, you can use the inserted scroll bar to change the year above. 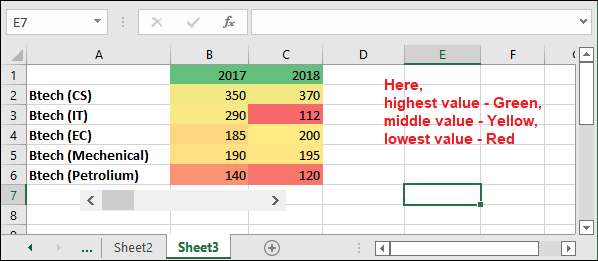
Here, the highest value is represented by green color, middle value by yellow color, and lowest value by red color. Step 17: We have clicked the scroll bar 3 times, see that the year and its below data is changed. 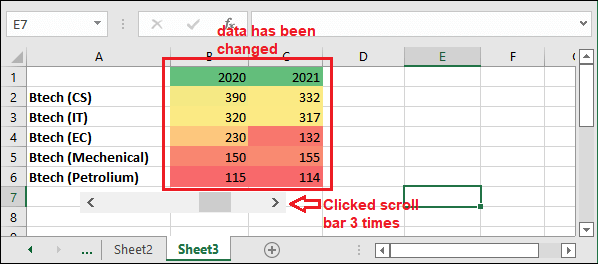
So, you have seen that - this dynamic heap map with scroll bar works in this manner. We have created this for a very small dataset. You can use it when you have a large amount of data. Example 2: Dynamic Heat Map using Radio ButtonsIn the previous example, you have learned the dynamic heap map using the scroll bar. Now, we will use the radio button to show the dynamic heap. You will see how differently dynamic heap map in different scenarios. We are using the same data that we used in example 1. To create the dynamic heap map with radio button, you have the following steps: Step 1: Initially, we have this simple data without any formatting and all. 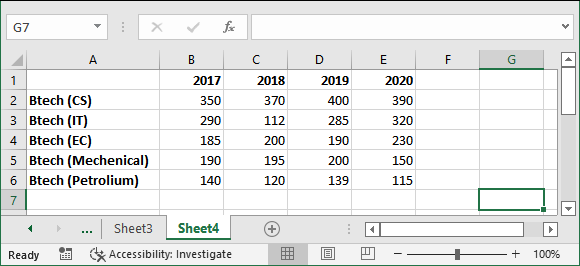
Step 2: Now, switch to the Developer tab in the Excel menu bar. Click Insert option and select the Option Button (Radio button) option from here. 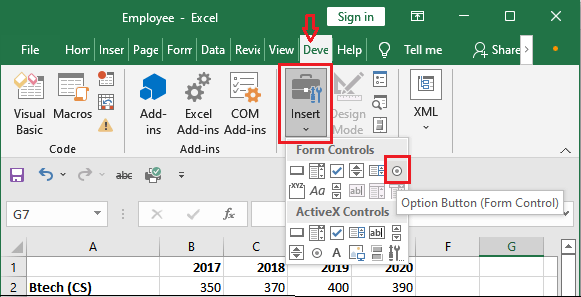
Step 3: Click anywhere on the sheet to insert the selected radio button in the sheet. 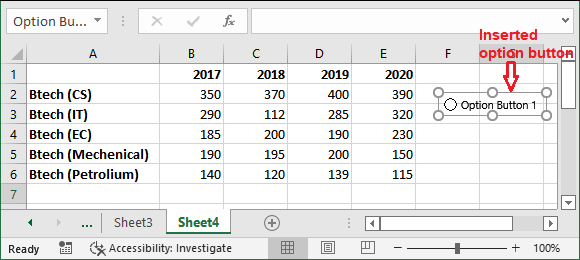
Step 4: Repeat the same process to insert one more radio button into the sheet. See as like below. 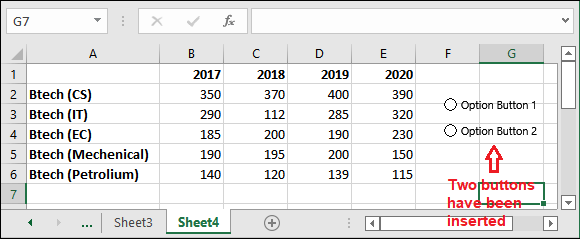
Step 5: You will see that two radio buttons have been inserted in the sheet. Now, place the buttons together and rename them as Larger Value and Smaller Value. 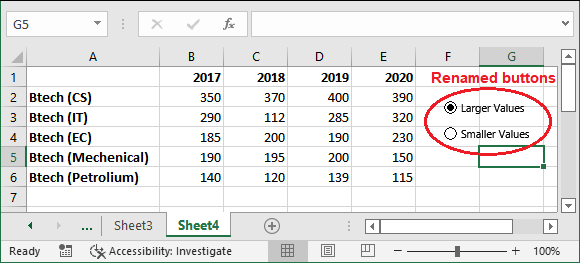
Step 6: Firstly, right-click on the Larger Value radio button and select Format Control from it. 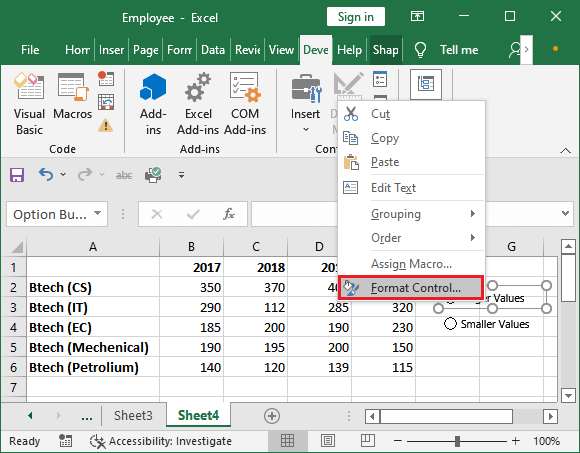
Step 7: A dialogue box will option where stay inside Control tab and click the Checked radio button and in Cell link field, enter a blank cell reference like $F$1. 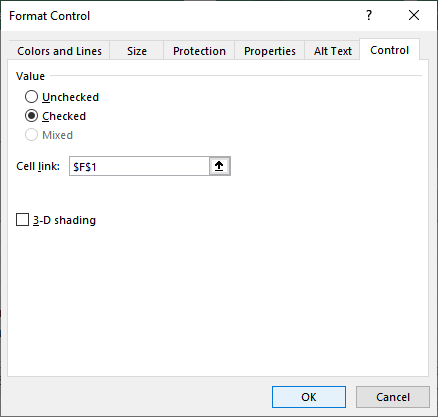
Step 8: Repeat the same steps for the Lower Value radio button. Now, the radio buttons are set for a dynamic heap map. Its time to set the conditional formatting on the dataset. Apply conditional formatting Step 9: Select the data that we had prepared for dynamic heap map and click the Conditional Formatting option inside the Home tab. After that, click on to New Rule. 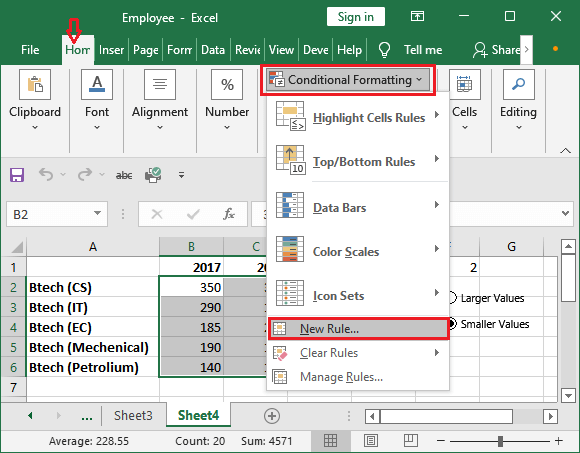
"We have selected New Rule because we want to create dynamic heap map using radio button." Step 10: A dialogue box named New Formatting Rule will open on which select the Use a Formula to determine which cells to format and write the formula as below. =IF($F$1=1,IF(B2>=LARGE($B$2:$E$6,10),TRUE,FALSE)) 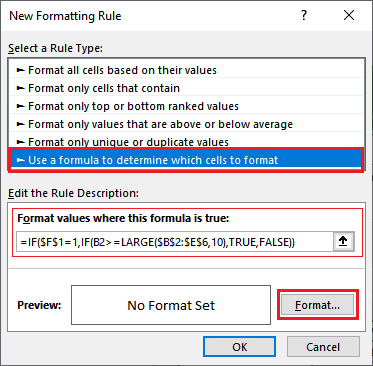
Click the Format button to apply color formatting on heap map data. Step 11: On the Format Cell dialogue box, switch to the Fill tab and select a color for background, click OK. 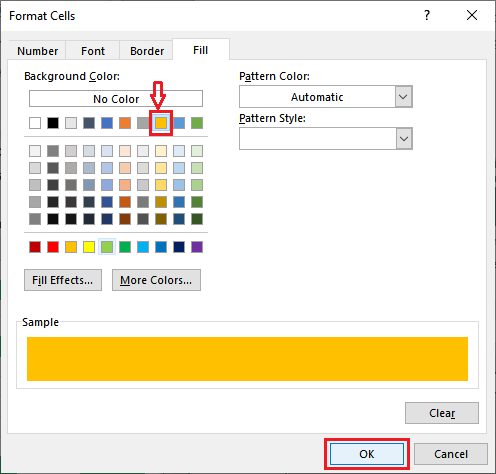
Step 12: Yellow color has been set as background to represent the larger values. 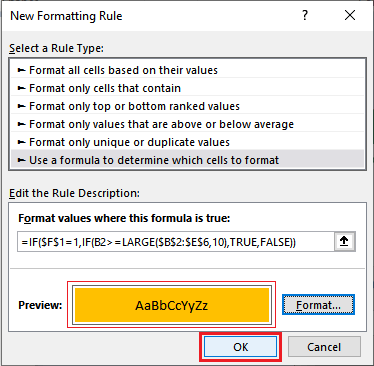
Step 13: For the above implementation, you will get the following result. 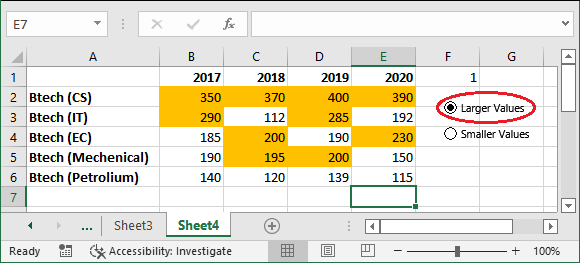
Step 11: Now, repeat the same process for highlighting the lower values with a different color one more time. While doing the steps for a lower value, write the following formula and choose a different color, e.g., Green. =IF($F$1=2,IF(B2<=SMALL($B$2:$E$6,10),TRUE,FALSE)) 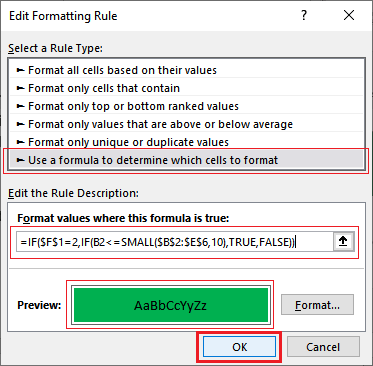
Step 12: After you set up the process for both lower and larger values, click the radio button one by one and see the changes for applied conditional formatting in the dynamic heap. 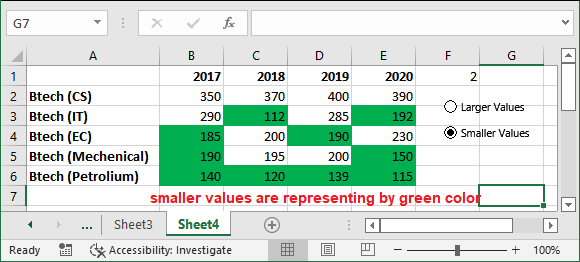
So, the radio button in dynamic heap works in this manner. In the same way, there are many more examples for creating a dynamic heap for the data stored in an Excel sheet. Application of heap mapsThe heap map can be used at various places in real-time scenarios. For example, we can use the heap map to analyze which country has the highest population by creating the heap map. Application in population map As we told you that heap map can be used to for mapping the population and get the visual representation for various parameters. Application in retail matrix This can also be used to get visual representation in departmental stores for retail matrix in MNC downtown. For example, you can use it to check which store received more supplies.
Next TopicExcel array formula
|
 For Videos Join Our Youtube Channel: Join Now
Feedback
- Send your Feedback to [email protected]
Help Others, Please Share


