Javatpoint Logo
Javatpoint Logo

Moving Average Formula

"A moving average (commonly known as a rolling average or running average) is an average calculated on the basis of subsets of data at specified intervals."

Computing an average at some intervals is essential as it smooths out the data by minimising the effect of unexpected fluctuations. Hence, Moving Average was introduced in Excel to display the overall trends, especially in a chart, easily. The larger the interval value, the more smoothing occurs since more data points are covered in each calculated average. Moving average is commonly used in the corporate world for technical analysis. However, it is also heavily used by stock-market analysts on a regular basis.

For example, let's suppose that you've collected daily temperature data past 10-days. If you are asked to compute the 3-day average temperature specifically for Day-3, you will compute the moving average temperature data of days 1, 2, and 3. Next, if you are asked to provide the moving temperature for Day 4, you will calculate the average of Day 2, 3, and 4.

Since we added a new one, we used the latest data, but the time period of three days was kept the same to calculate the moving average.

Types of Moving Average

In Excel, there are three types of Moving Average, which are as follows:

  1. Simple moving average (SMA)
    SMA or Simple moving average calculates the simple average of the data points for a specified time period. For example, if you want to calculate the average daily temperature of the past 7 days, it returns the 7-day simple moving average.
  2. Weighted moving average (WMA)
    The temperature is shooting up with every passing day, and you are using a 10-day moving average to obtain the temperature analysis.
    Day-10 temperature is considered to be more precise with temperature values and a better indicator of the temperature than Day-1 (since the temperature is shooting up every day and it is maximum with Day-10).
    To reflect the above case using moving average, you can provide more significance to the latest data and less to previous data. This way, you still obtain the output with more impact from the latest data.
    This method is known as the Weighted moving average.
  3. Exponential moving average (EMA)
    The Exponential Moving Average is not a new concept. It has emerged from the weighted moving average only. In this, the user provides more weight to the new data points, therefore decreasing exponentially for the previous data values.
    The only difference between Exponential Moving Average and Weighted moving average is that with WMA, you can allocate weights on the basis of any preferred criteria.

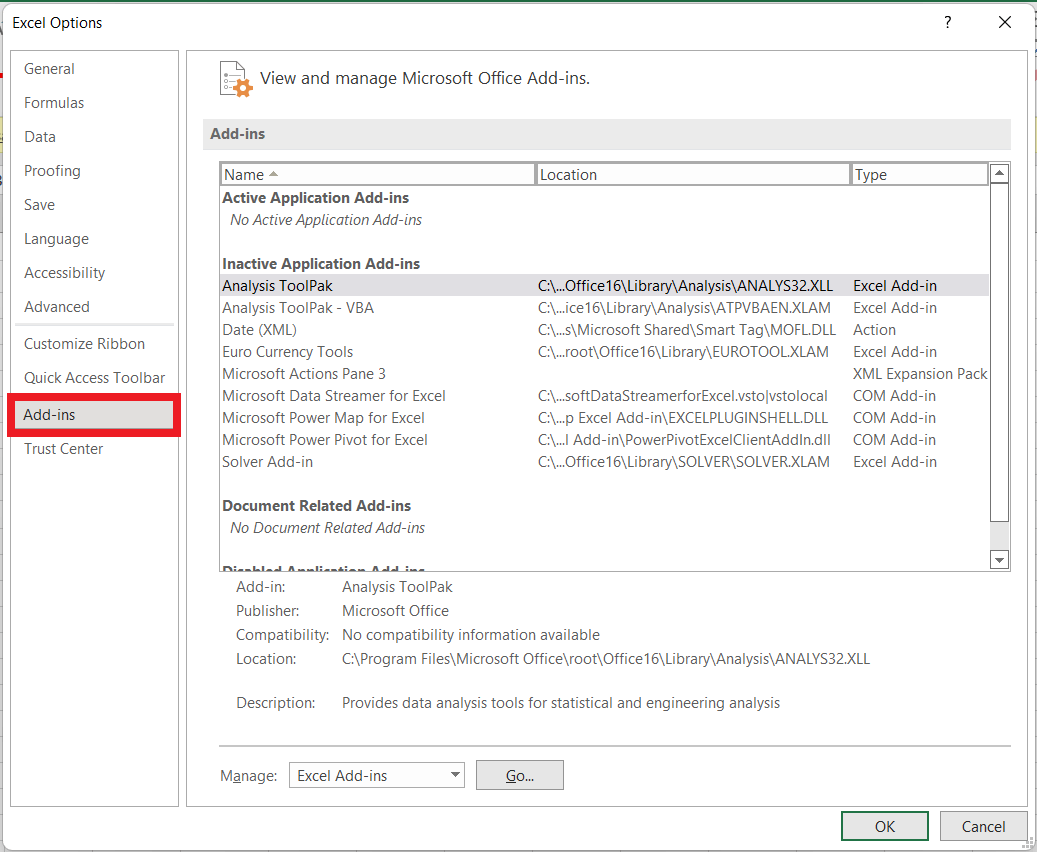
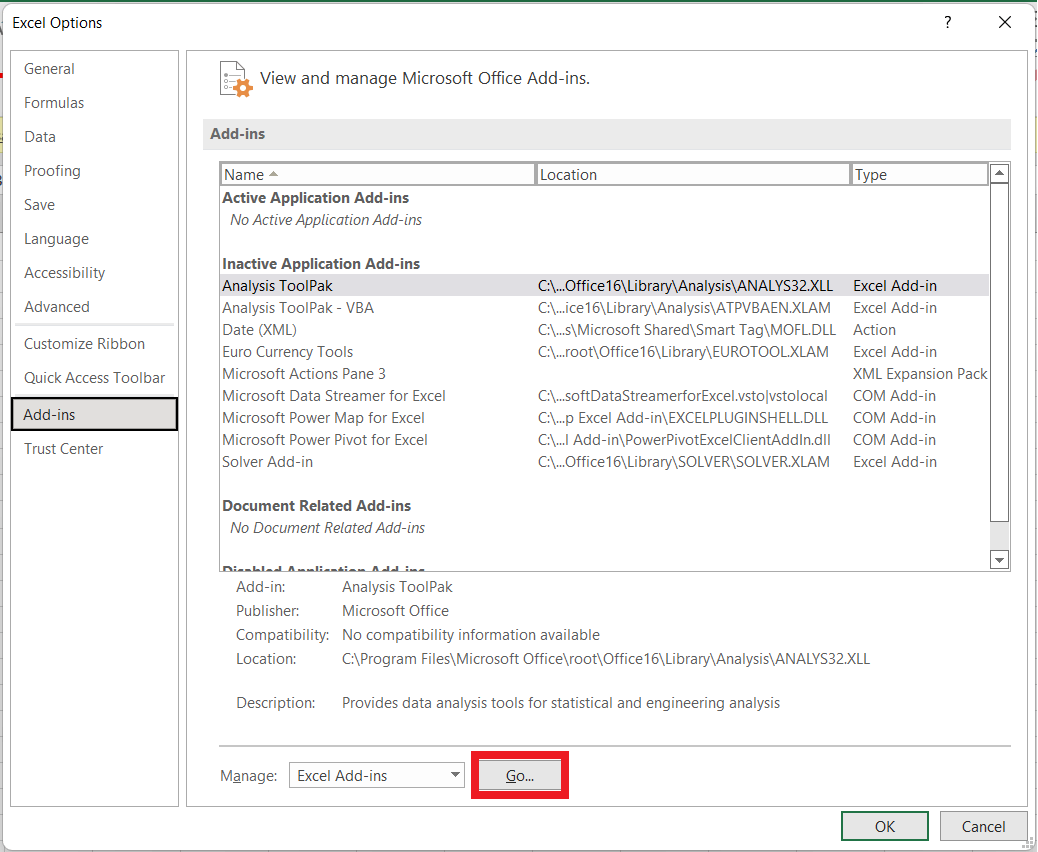
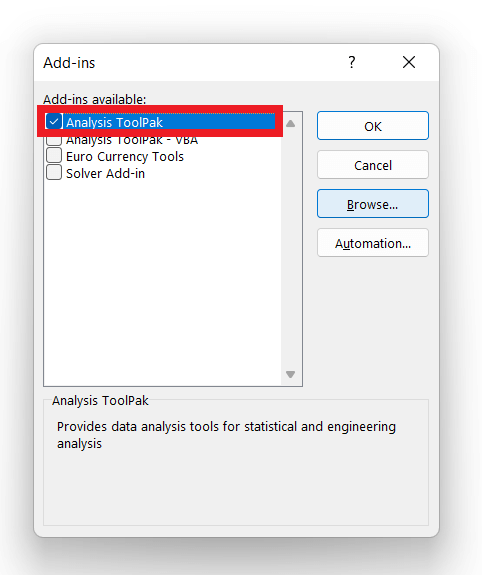
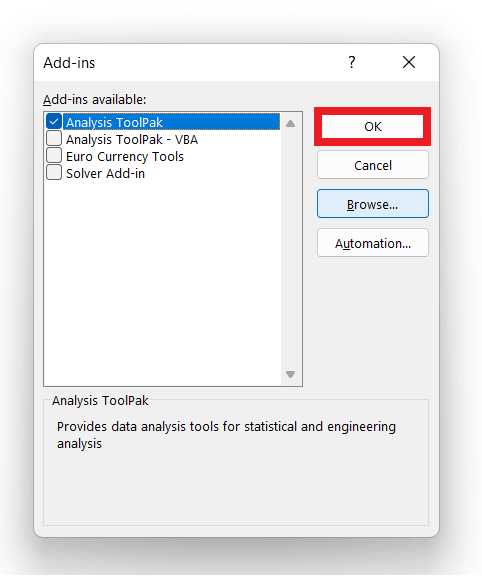
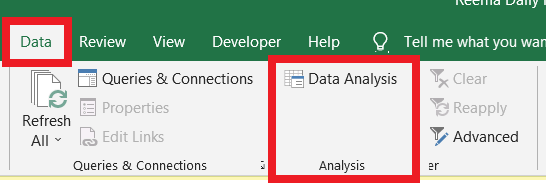
Calculating Moving Average using Data Analysis Toolpak

Because of the importance of Moving Averages, Excel introduced a built-in tool to quickly calculate the simple moving averages. The tool is known as Data Analysis Toolpak.

Many times, you might not find the Data Analysis Toolpak option on your Excel ribbon. Don't worry, you just need to do is to quickly quickly enable it from Excel settings.

NOTE: If you find the Data Analysis Toolpak option already enabled in the Excel Data Tab, skip the following steps and directly jump on calculating moving averages.

Steps to Enable Data Analysis Toolpak in Excel

Click on the Excel Data tab and look for the Data Analysis option. If you don't find it, follow the given below steps to make it appear in the Data tab section:

  1. From the Excel Ribbon tab, click on File.
    Moving Average Formula
  2. The following window will appear. Click on Options.
    Moving Average Formula
  3. Excel will throw the Excel Options dialog box. From the given set of option click on Add-ins.
    Moving Average Formula
  4. Go to the bottom of the page and from the drop-down select Excel Add-ins. Click on the Go option.
    Moving Average Formula
  5. You will notice that the Add-ins dialog window will appear. Tick on the Analysis Toolpak checkbox option.
    Moving Average Formula
  6. Click OK.
    Moving Average Formula
  7. Once done, the Data Analysis Toolpak option will be enabled successfully. Now, you can this option in the Data tab window.
    Moving Average Formula

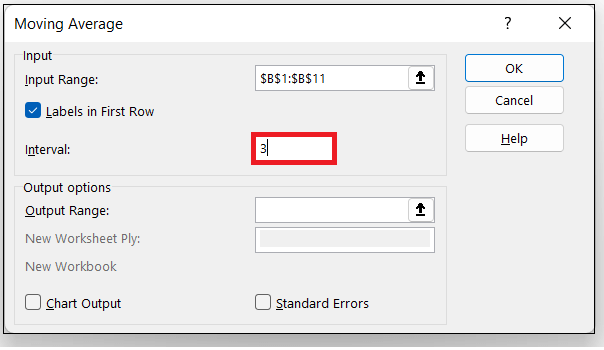
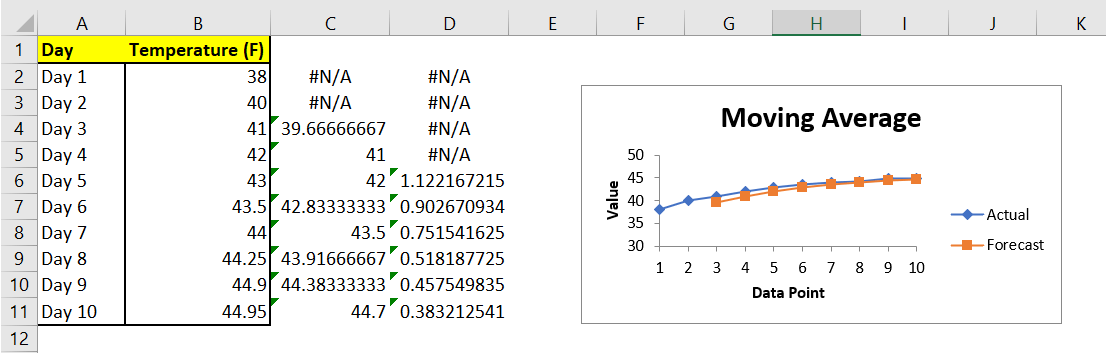
Steps to calculate Moving Average using Data Analysis

In the below table, we have collected daily temperature information for 10 days. Using the details compute the three-day moving average and fetch the output for the simple weather forecasting.

Moving Average Formula

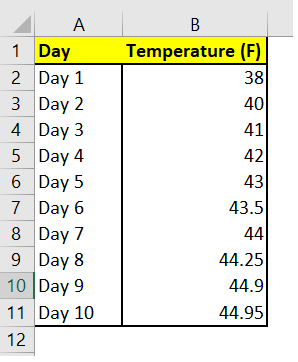
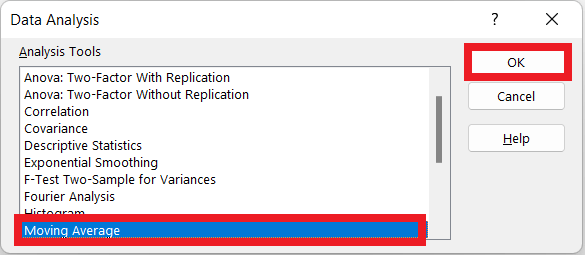
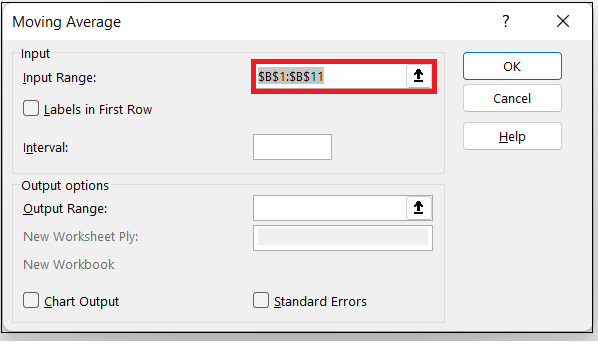
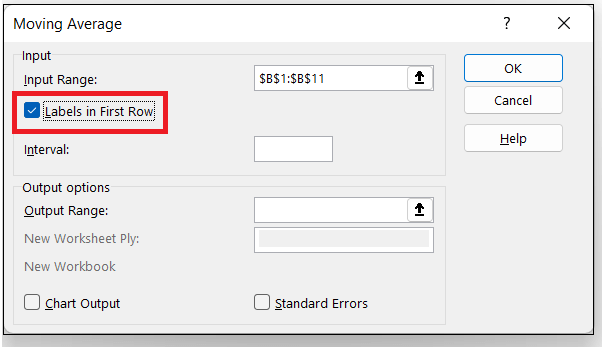
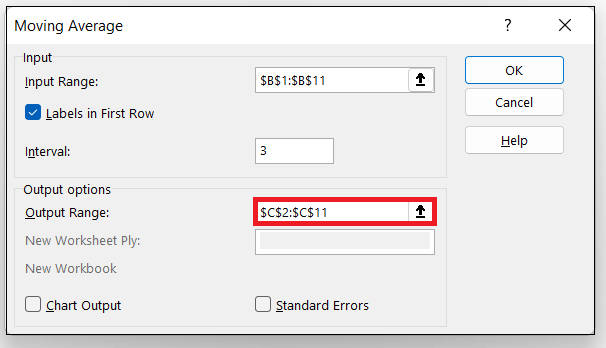
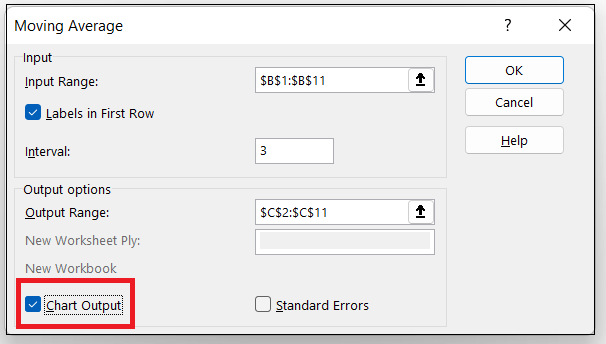
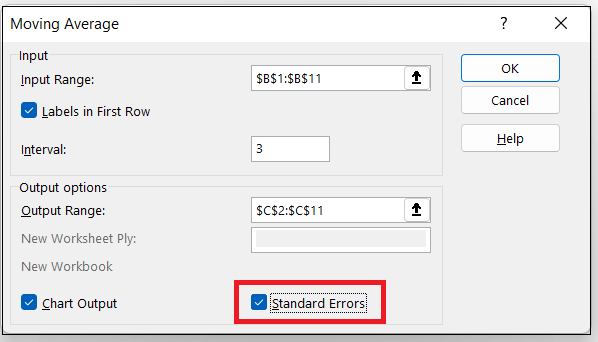
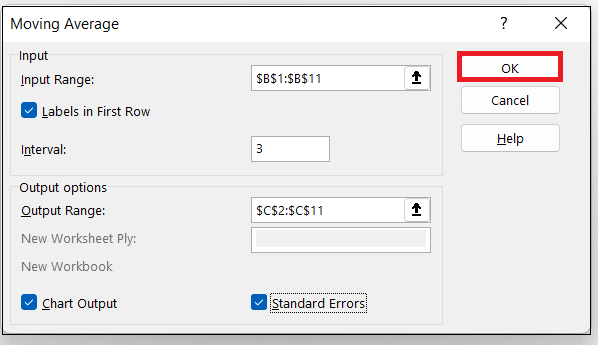
To calculate moving averages for the above data set using Data Analysis Toolpak, follow the below-given steps:

  1. The step is to click on the Data tab-> Data Analysis command option.
    Moving Average Formula
  2. The Data Analysis dialog window is prompted. From the listed option select the Moving Average and click on OK.
    Moving Average Formula
  3. As the result, the Moving Average dialog window will appear. Next, we will specify the input range text box of our dialog window. In the input range text either select the worksheet range using your cursor or manually enter the range address.
    Moving Average Formula

NOTE: Ensure that the entered range should be absolute cell addresses. In absolute cell addresses, the columns and rows are locked with $ signs, as in $B$1:$B$11.

  1. If the first Row of your input range contains header or text data, check the checkbox for Labels in the first Row, as it helps Excel identify or describe your text data. Since in our data, the first Row contains a header, so we have ticked it.
    Moving Average Formula
  2. In the Interval text box, specify exactly how many values you want to include in the moving average calculation. You can calculate a moving average for any number of values. By default, it automatically takes the most recent three values. But if you want to change it and calculate the moving average for some other numbers of values, enter the number into the Interval text box.
    Moving Average Formula
  3. In the Output Range text box field, we will specify the Excel range to which we want to move the moving average data. In our case, the moving average data has been placed into the Excel range C2:C10.
    Moving Average Formula
  4. (Optional) The next option if to select whether you want to represent the data using a chart or not. If you want a chart to display the output of your moving average, tick the Chart Output check box.
    Moving Average Formula
  5. (Optional) Excel also provides an option to check the standard error information for the calculated values. If you want to make the process more robust, you must calculate standard errors for the data. Select the Standard Errors check box.
    Moving Average Formula
  6. Once all the above steps are finished, click on the OK button.
    Moving Average Formula
  7. As a result, Excel calculates moving average for the given data set. You can see the Moving chart as well displaying the output.
    Moving Average Formula
    The disadvantage of using the Data analysis Toolpak method is that it only works when the user wants to calculate the Simple Moving Average problems, but what if you want to calculate the output for Exponential Moving Average and Weighted moving average. For such cases, you have to opt for Excel formulas.

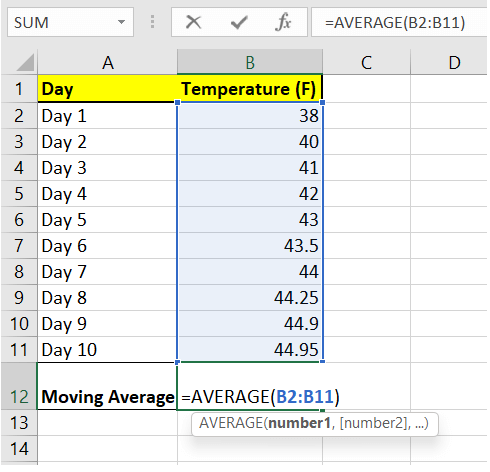
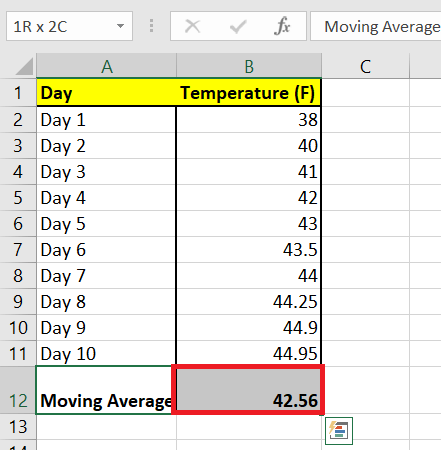
Calculating Moving Averages (SMA, WMA, EMA) Excel using Formulas

Since the above method was only useful for calculating the Simple Moving Averages, we need a dynamic solution that will help us to calculate any type of moving average. Therefore, the best solution to the above problem is to use Excel's inbuilt AVERAGE formula.

In fact, if your only requirement is the moving average value (and not the standard error or chart), the best approach to fetch the output is by using the Average formula (and faster) rather than using the Data Analysis Toolpak.

Example 1: Calculate Simple Moving Average (SMA) using Excel Average Formula method

Let's Suppose you have the following Excel data and you want to calculate the 3-point simple moving average:

Following are the steps to calculate moving averages for the above data set using formulas:

  1. Select a cell to enter the formula.
  2. Start the formula using the equals to (=) sign, and type AVERAGE. In the parameter, select the data for which you want to calculate the moving averages.
    =AVERAGE(B2:B4)
    Moving Average Formula
  3. When calculating SMA using formulas, always enter the data reference using relative reference. This means both the formulas =AVERAGE(A1:A5) or =AVERAGE($A1:$A5) will work, but it you cannot enter =AVERAGE($A$1:$A$5) or =AVERAGE(A$1:A$5). In simple words, the row reference needs to be without the dollar symbol.
  4. Once done, click on the enter button. Excel will return the following output.
    Moving Average Formula

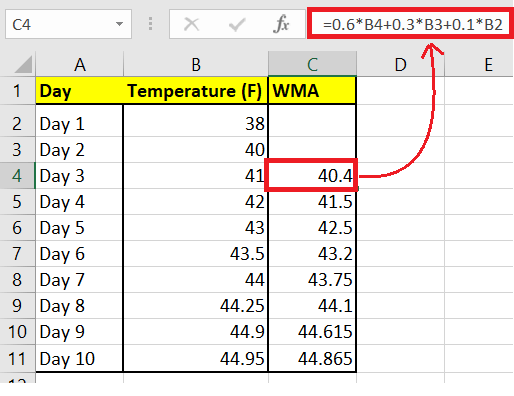
Example 2: Calculate the Weighted Moving Average using Excel Formulas method

For this example, let's suppose you need to calculate the 3-point Weighted Moving Average for the following Excel data, where 50% weight is allocated to the new data points, 30% to the one before it and 20% to the previous ones.

Moving Average Formula

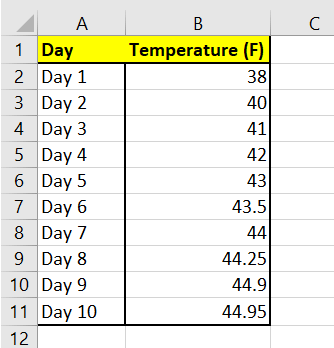
Following are the steps to calculate weighted moving averages for the above data set using formulas:

  1. Select a cell to enter the formula.
  2. Start the formula using the equals to (=) sign, and type the below formula.
    =0.6*B4+0.3*B3+0.1*B2
  3. Drag the formula cell and repeat it down the cells. Excel will return the output after calculating the Weighted Moving Average for given data set.
    Moving Average Formula

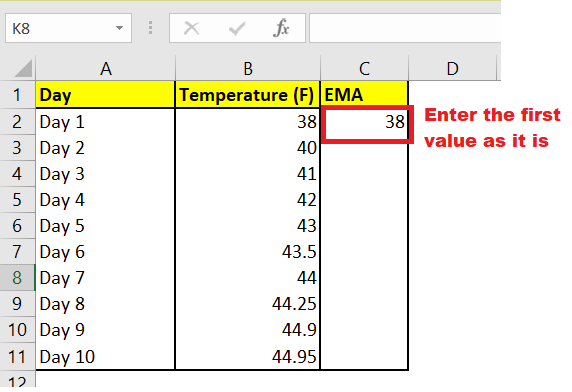
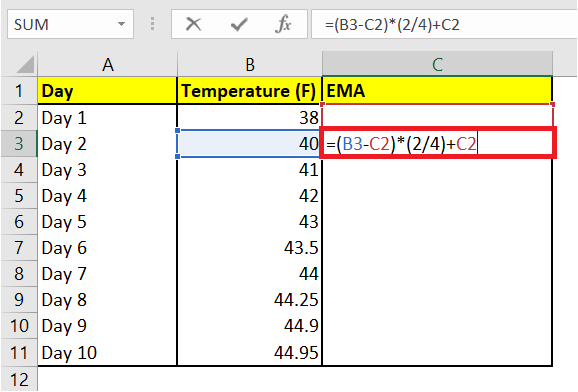
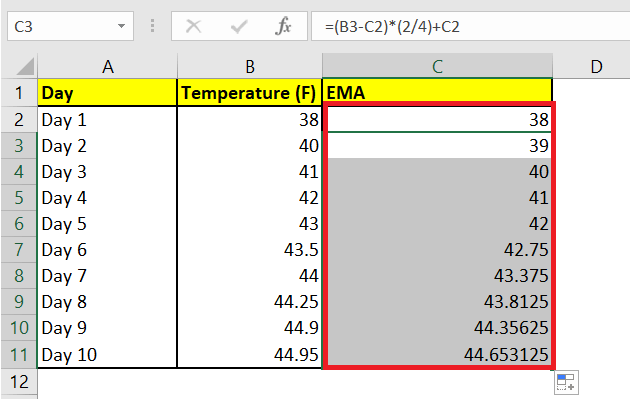
Explanation of the above formul

Since in the question, we are asked to calculate a 3-point Weighted Moving Average (WMA), therefore we are left the first two cells empty (Day 1 cell and Day 2 cell), and we have applied the formula from the third day onwards.

Example 3: Calculating Exponential Moving Average using Formulas

Exponential Moving Average (EMA) is a method where the user gives more weight to the latest data set, and further, the weights keep decreasing exponentially for previous data values.

The Formula to compute the Exponential Moving Average for a three-point data value is as follows:

EMA = [Latest Value - Earlier EMA Data Value] * (2 / N+1) + Earlier EMA

Where, N represent 3 (because in the question we are asked to calculate the three-point EMA)

Note: There won't be any earlier data value for the first EMA data set to calculate EMA. For the initial data set, it simply accepts the data value as it is and considers it as the EMA value. You can then use this value for future calculations.

Following are the steps to calculate moving averages for the above data set using formulas:

  1. For the first cell C2, enter the same value as in B2. This is because there is no previous value to calculate EMA.
    Moving Average Formula
  2. Select a cell to enter the formula.
  3. Start the formula using the equals to (=) sign, and type the below formula.
    =(B3-C2)*(2/4)+C2
    Moving Average Formula
  4. Drag the formula cell and repeat it down the cells. Excel will return the output after calculating the Weighted Moving Average for given data set.
    Moving Average Formula
    In this example, we have kept the formula simple and used the latest value and earlier EMA value to calculate the current EMA.

Errors with Moving Average

Excel returns the error message into the cell if the user doesn't provide sufficient data to calculate a moving average for a standard error. You can notice several cells that display this error message as a value.


Youtube For Videos Join Our Youtube Channel: Join Now

Feedback


Help Others, Please Share

facebook twitter pinterest

Learn Latest Tutorials


Preparation


Trending Technologies


B.Tech / MCA