| |

How can one perform Data Analysis in Microsoft Excel: DATA ANALYSIS TOOLWhat do you mean by Data Analysis tool in Microsoft Excel?It was well known that we have some inbuilt tools efficiently used to perform Data Analysis in Microsoft Excel. But these will become active only in case when we primarily select any of them from it respectively. Moreover, to enable the Data Analysis tool in Microsoft Excel, we need to go to the File menu's Options tab, and once we get the Excel Options window from the Add-Ins, then after that we are required to select any one of the analysis packs, let us say Analysis Toolpak. Now we will be then clicking on the Go option, as this will be redirected to the window from which we can select one or of the multiple Data analysis tool packs that can be seen just under the Data menu tab. If, in case, we observe Microsoft Excel on our laptop or our computer, then we may not see the data analysis option by default. And in that, we need to unleash it properly, and data analysis tool packs are primarily available just under the Data tab as well. 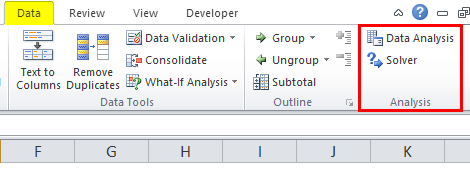
Now after that, we can see many analysis options under the Data Analysis option as well. 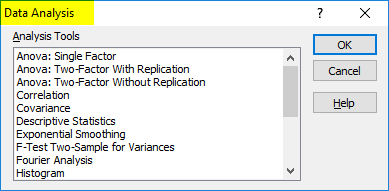
How one can easily unleash Data Analysis Tool Pack in Microsoft Excel?If Microsoft Excel is not showing this pack, then, in that case, we are required to follow the below steps for the purpose of unleashing this option. Step 1: First, we need to go to the FILE option, and then we will proceed to the further step. 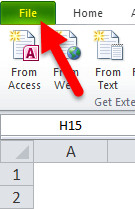
Step 2: After that, we will select the Options just under the File. 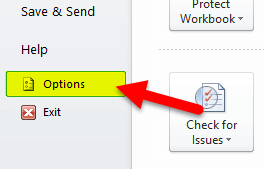
Step 3: Now, in this step, we will be selecting out the Options and then will select the Add-Ins option respectively: 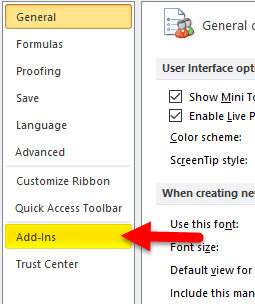
Step 4: After that, once when we click on the Add-Ins, present at the bottom, then we will see the Manage drop-down list. And selecting the Excel Add-ins and click on the Go option as well. 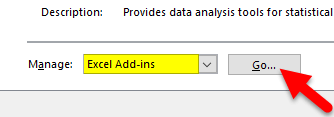
Step 5: Once we click on the Go option, we will see a new dialogue box on the screen. We will see all the available Analysis Tool Packs, and in this, we have primarily selected 3 of them and then clicked on Ok, respectively. 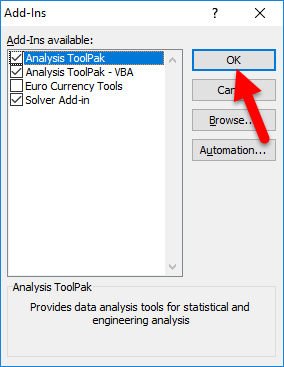
Step 6: After that, we can see these options just under the Data ribbon efficiently. 
What basic types of tests can be performed to analyze Excel data?The basic types of the test that can be efficiently performed to do the data analysis in Microsoft Excel are as follows: 1) Descriptive Statistics in Microsoft Excel It was well known that we wanted first to get Microsoft Excel's descriptive statistics, no matter what statistical test we were running. And this will give us information on means, medians, variance, standard deviation, error, kurtosis, skewness, and other figures. Moreover, running descriptive statistics in Microsoft Excel is very easy. We must click on the Data Analysis in the Data tab and select Descriptive Statistics; after that, we must select our input range per our requirement. After that we are required to click on the arrow next to the input range field, and we will be clicking as well as dragging out in order to select our data and hit Enter option. 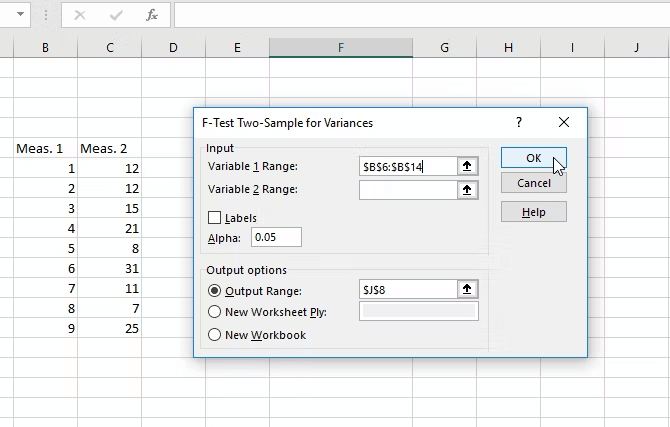
After that, we will tell Microsoft Excel whether our data have labels, if we want the output in a new sheet or on the same one and if we want summary statistics and other options. 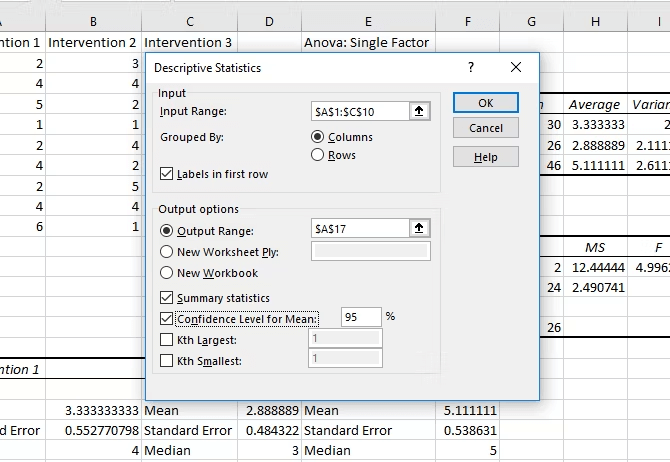
After that, we will be hitting on the OK option, and we will be getting our descriptive statistics as well: 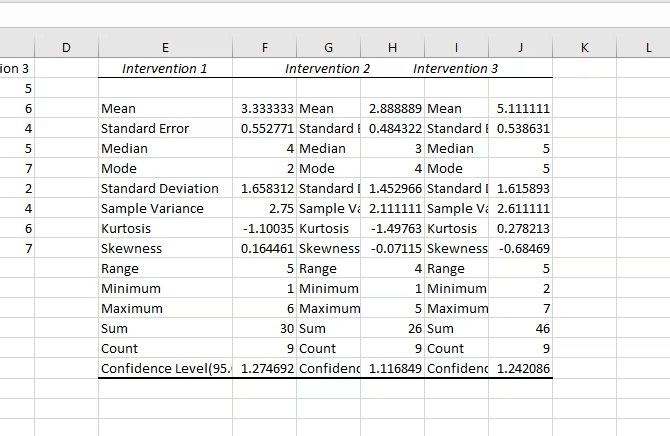
2) T-text in Microsoft Excel It was well known that the t-test is considered one of the most basic statistical tests, and it is much easier to compute in Microsoft Excel with Toolpak. As for this, we need to click on the Data Analysis button and scroll down until we encounter the t-test options. 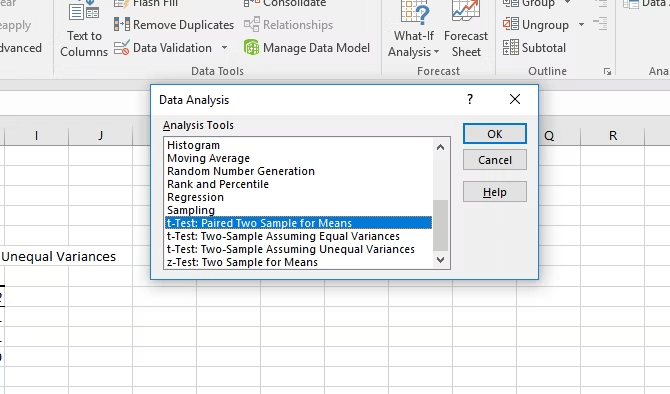
For this, we primarily have three basic choices, which are as follows:
And to test whether the given variances of our two samples are equal, we all need to run an F-test. So to find out the F-Test Two-Sample for Variances in the Analysis Tools list, we will select it and then click on the OK option. 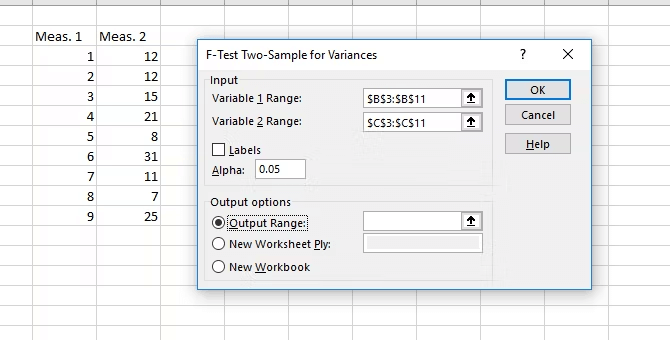
Furthermore, we also need to enter our two datasets in the input range boxes. And leaving out the alpha value at 0.05 unless we have reason to change it -- if we do not know what that means, leave it, and finally, we will click on the OK option. And Microsoft Excel usually provides us with the results in a new sheet (unless we have selected the Output Range and a particular cell in our current sheet, respectively. 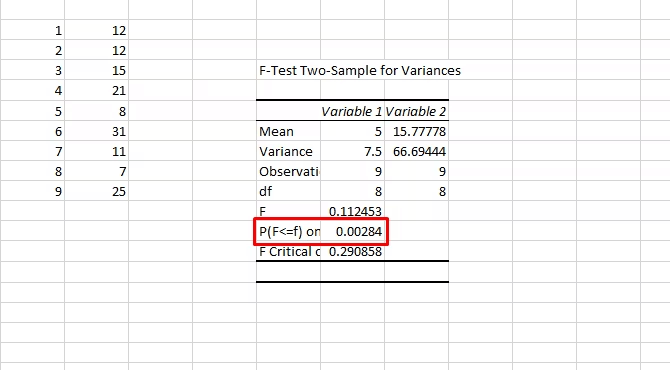
Now we are looking at the P-value; if it is less than 0.05, we have unequal variances. To run the t-test, we should also use the unequal variances option. And to run a t-test, we need to select the appropriate test from the Analysis Tools window and then select both sets of our data in the same manner as we did for the F-test efficiently, leaving out the alpha value at 0.05, and hit the OK option, respectively. 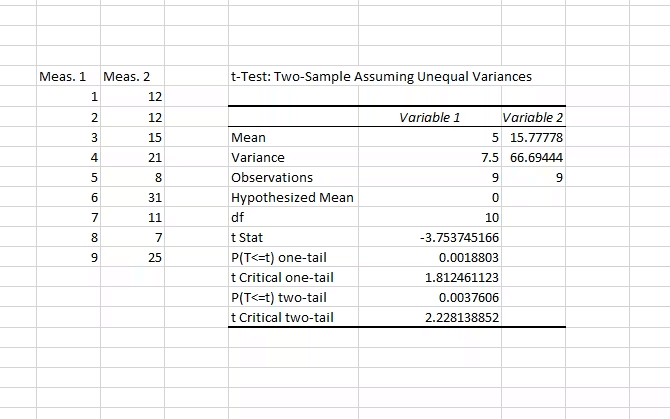
And the results will include everything we need to report for a t-test: the degrees of freedom (df), t statistic, and the P-values for both one- and two-tailed tests. And if the P-value is less than 0.05, the two samples are significantly different. 3) ANOVA in Microsoft Excel We all know that the Microsoft Excel Data Analysis Toolpak primarily offers three variance analysis types (ANOVA). And much more it does not give us the ability to run the necessary follow-up tests, which are as follows:
Now here are the three basic ANOVA tests which are primarily used in Microsoft Excel:
Just after that, we will be moving over the single-factor analysis as well. As in our example, we will be looking at the three sets of numbers, which are primarily labeled as "Intervention 1," "Intervention 2," as well as the "Intervention 3." And to run an ANOVA, we will click on the Data Analysis, then select ANOVA: Single Factor respectively. 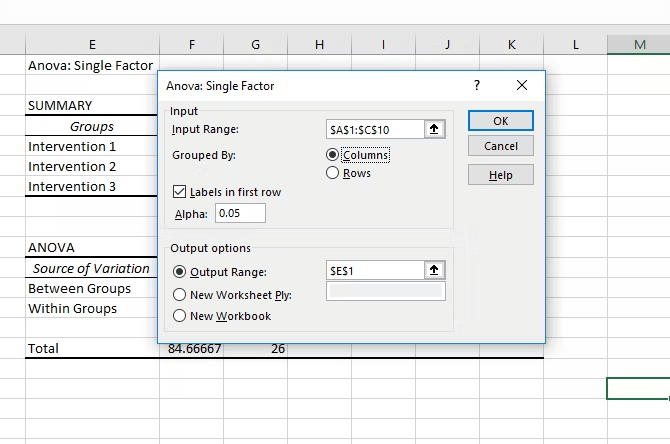
And we need to select the input range and tell Microsoft Excel whether our groups are in columns or rows. We have also selected "Labels in the first row" to display the respective group names in the results. After hitting the OK option, we get the following outcomes: 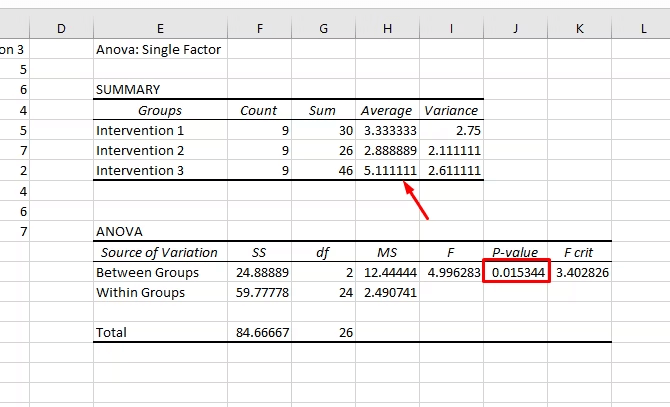
Moreover, it should be noted that the P-value must be less than 0.05, so we have a significant result. That means there is a significant difference between at least two groups in the test. But because Microsoft Excel does not provide tests to determine which groups differ, the best we can do is look at the averages in summary. In our example, Intervention 3 is likely the one that differs respectively. This is not statistically sound. But it will work if we want to see if there is a difference and see which group is causing it. And the Two-factor ANOVA is more complicated. If we want to learn more about when to use the two-factor method as well: 4) Using Regression in Microsoft Excel It is well known that Regression is considered one of the most commonly used statistical tests in the respective industry, and Excel also packs a surprising amount of power for this calculation. We will be running a quick multiple regression in Excel here. Let us say that our dependent variable is blood pressure, and our two independent variables are weight and salt intake, and we want to see which a better predictor of blood pressure is. First, we will click on Data Analysis and select Regression. And we need to be careful when filling out the input range boxes this time. The Input Y Range box must contain our single dependent variable, whereas the Input X Range box can include multiple independent variables. For a simple regression, we do not need to worry about the rest, and here is what our calculation exactly looks like: 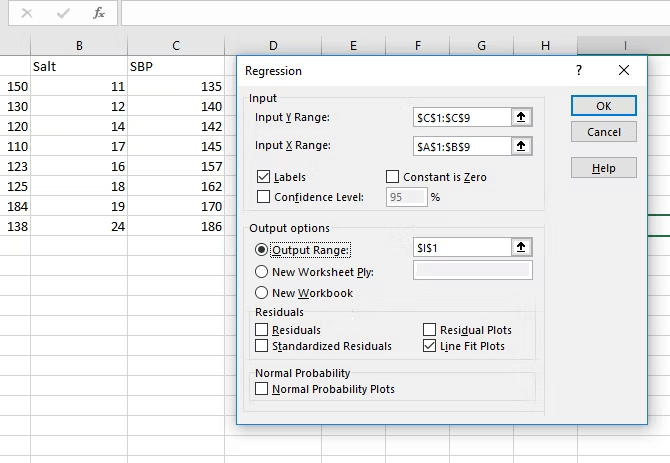
And after hitting the OK option, we will get a big list of results. We have highlighted the P-value here for both weight and salt intake as well: 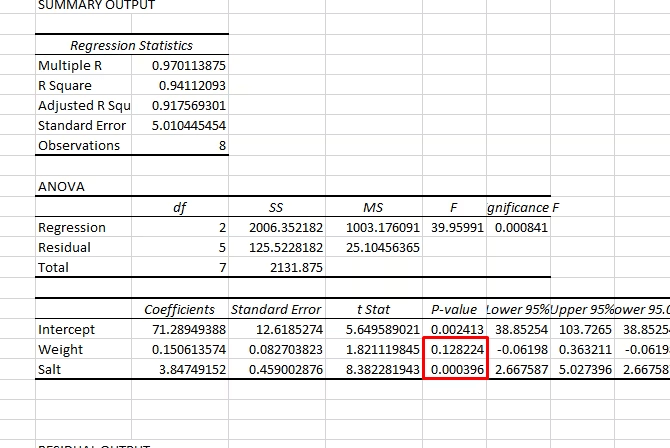
As we can see, the P-value for weight is greater than 0.05, so there is a little significant relationship. However, the P-value for salt is below 0.05, indicating that it is a good predictor of blood pressure. 5) Making use of Correlation in Microsoft Excel Calculating Correlation in Microsoft Excel is much simpler than the t-test or an ANOVA. We need to use the Data Analysis button to open the Analysis Tools window and select the Correlation. 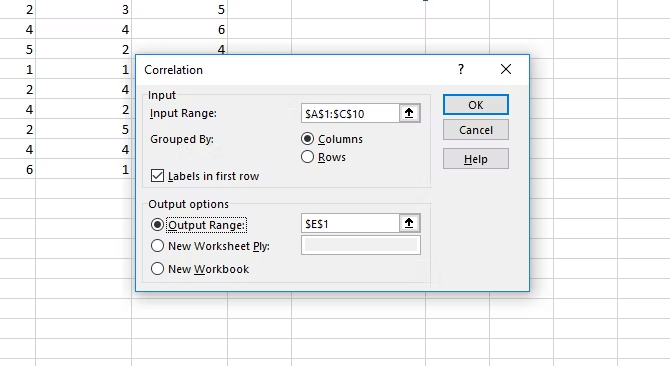
We need to select our input range, and we need to identify our groups as columns or rows and tell Microsoft Excel whether we have labels. After that, we will be hitting on the OK option. 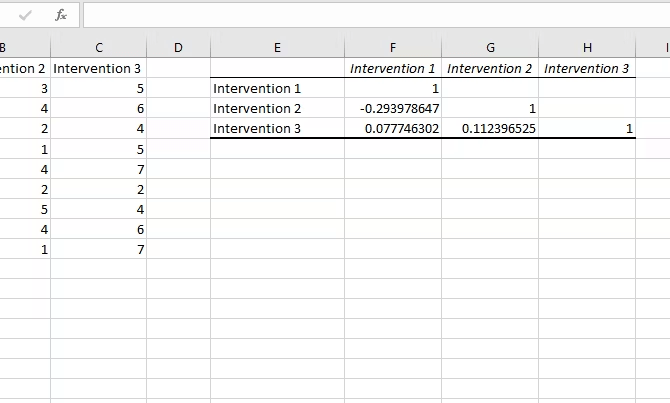
And we won't get any measures of the respective significance, but we can see how each group is correlated with the others. And a value of one is an absolute correlation, indicating that the values are the same. How to make use of the Data Analysis Tool in Microsoft Excel?Let us now we will understand the working of a data analysis tool with some examples as well: # Example 1: T-TEXT ANALYSIS It was well known that a t-test returns the probability of the particular tests. And looking at the below data of two teams scoring patterns in the given tournament respectively: 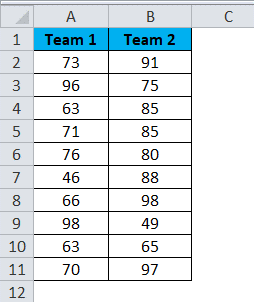
Step 1: First, we must select the Data Analysis option, also under the DATA tab. 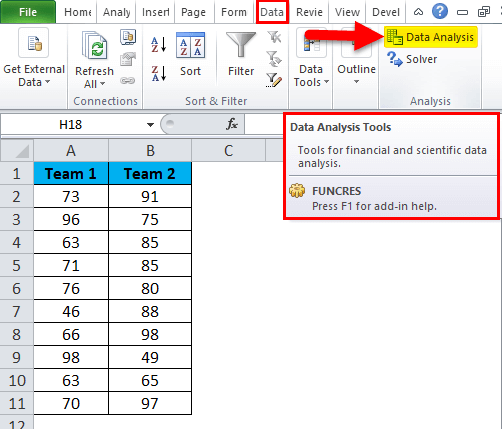
Step 2: Once we click the Data Analysis, we will see a new dialogue box. Scrolling down as well as finding out the T-test. Under the T-test, we will have three kinds of T-test which we have discussed in the above section of the T-Text; then after that, we will be selecting out the first one, which is none other than the t-Test: Paired Two Sample for Means efficiently: 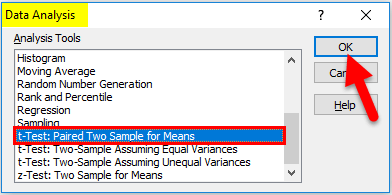
Step 3: After that, we will select the first t-Test, which we will see in the options below. 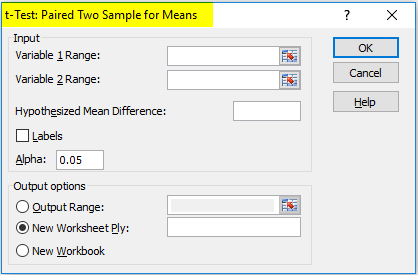
Step 4: Now, in this step, just under the Variable 1 Range, we will select out the Team 1 score, and under the Variable 2 Range, we will select out the Team 2 score effectively. 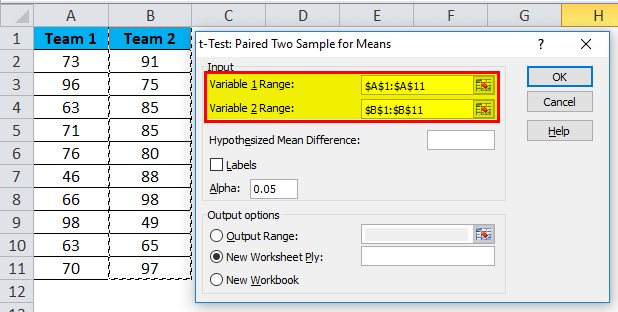
Step 5: After that, under the output Range, we will select the cell where we usually want to display the results. 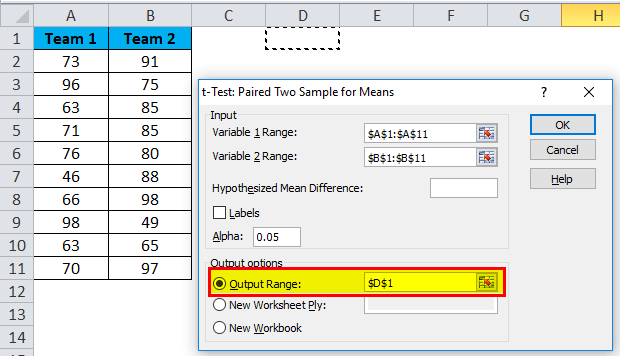
Step 6: Just after that, we will be then clicking on the Labels this is because we have selected out the ranges, including the headings. And we will be clicking on the Ok option in order to finish out the test efficiently. 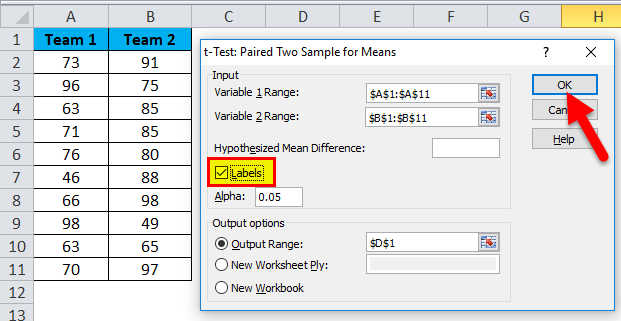
Step 7: And from the cell D1, it will be just show the test output respectively. 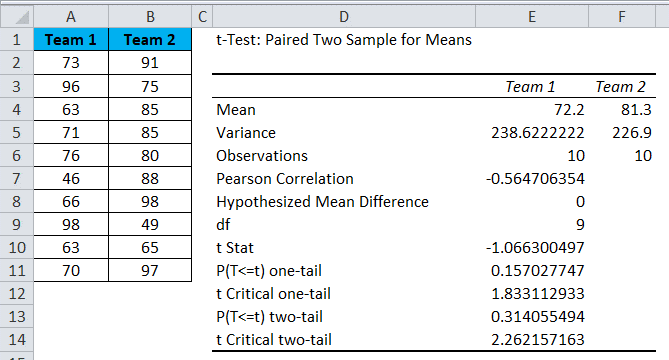
And the outcome will then show the mean value of the two teams, Variance Value, how many observations are conducted or how many values are taken into consideration, Pearson Correlation, etc. If we are having P (T<=t) two-tail, it is 0.314, higher than the standard expected P-value of 0.05, which means that the data is not significant anymore respectively. # Example 2: SOLVER Option A solver is nothing but solving the problem. SOLVER primarily works like goals seek in Microsoft Excel. And looking at the below image. We have data on product units, unit price, total cost, and total profit. 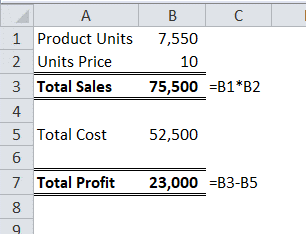
As well as the total number of units sold quantity is 7550 at a selling price of 10 per unit. And the total cost is 52500, and the total profit is 23000. Moreover, as a proprietor, in which we want to earn a profit of 30000 is just by increasing the unit price. As of now, we are still determining how much the unit's price we have to increase. Step 1: And first of all, we need to Open SOLVER just under the DATA tab respectively: 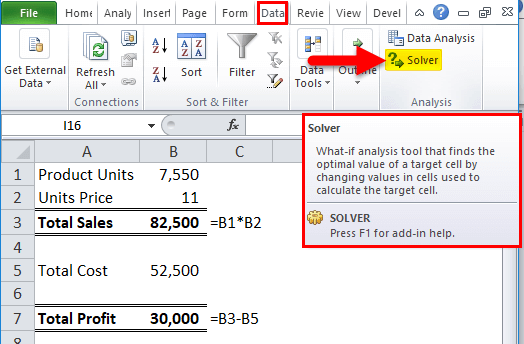
Step 2: Just after that, we need to set out the objective cell as B7 and the value of 30000 by changing the cell to B2. Since we do not have any other special criteria to test, we will also click on the SOLVE button. 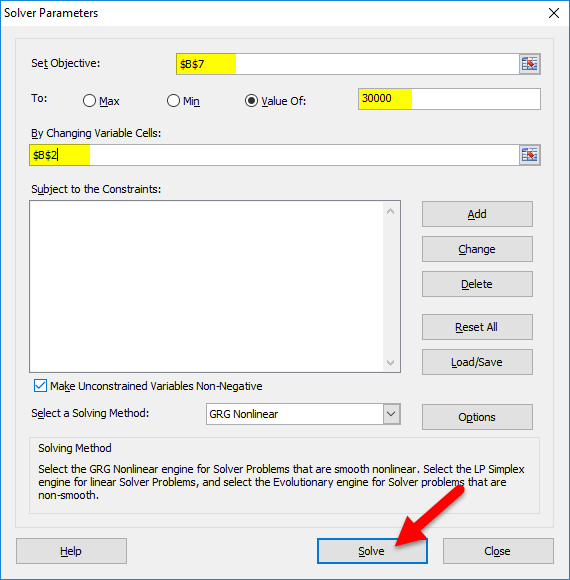
Step 3: And the Result will be as below: 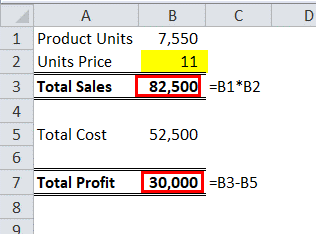
Ok, excel SOLVER will solve the problem for me. And to make a profit of 30000, we need to sell the products at 11 per unit instead of 10 per unit. In this way, we can analyze the data respectively. |
 For Videos Join Our Youtube Channel: Join Now
Feedback
- Send your Feedback to [email protected]
Help Others, Please Share


