How to find duplicates in Excel?What is duplicate data?In Excel, Duplicate data is defined as data similarity or repeatedly occurring in the data. Duplicate data appears for many reasons, such as an error in data entry or copying and pasting the same data multiple times. Reason for occurring duplicate dataThere are several reasons for duplicate values in the given data. Some of the values are listed below:
Unique or Distinct ValuesThe concept of unique or Distinct Values is explained as follows: Unique Values: As the name suggests, the unique values appear only once in the list. The meaning of distinct refers to the same as unique, where it displays the one-time value appearing in the given data range. Methods to find duplicate data in ExcelExcel provides various methods to find duplicate data in Excel. The methods are listed as follows:
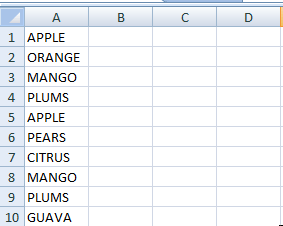
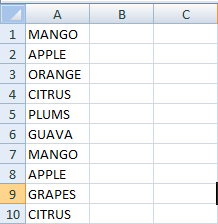
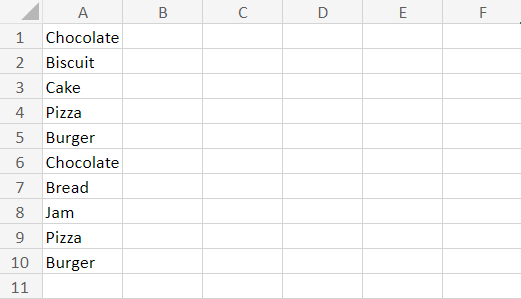
The methods are explained with examples as follows, 1. Remove DuplicatesAs the name suggests, the remove duplicate function removes or finds the duplicate value in Excel. It is present in the ribbon tab in the Data section. The example to remove duplicates in the data is as follows: 1. Enter the data in the column range, namely A1:A10. 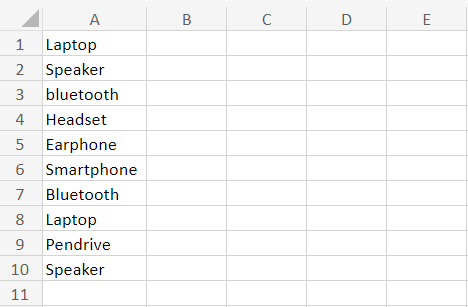
2. Select the data range from A1:A10. Click the option "Data" from the Ribbon tab. In that, choose the Remove Duplicates option. 
3. A pop-up message will display regarding how many duplicate values are found in the cell and the remaining unique values in it. 
4. The Remove Duplicate function removes the duplicate values present in the data. 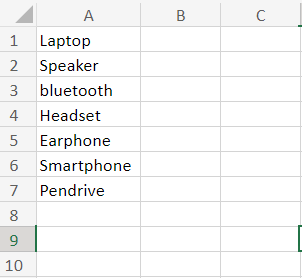
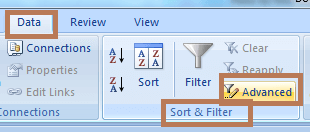
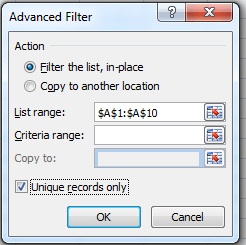
In the worksheet, the repeated data present in cells A8, A9, and A10 are removed. 2. Sort and Filter MethodThe Sort and Filter Methods are used to filter the unique values. It is present in the Ribbon tab in the Data option. The steps to be followed to use Sort and Filter Method are as follows:
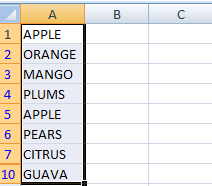
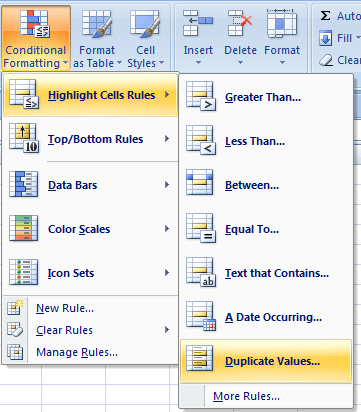
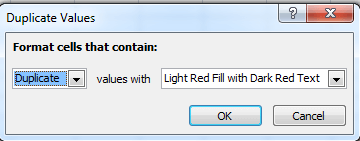
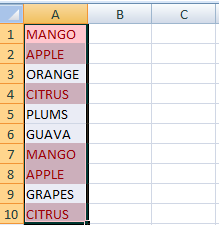
In the worksheet, cells A8 and A9 are removed, duplicated, and unique values are filtered. 3. Conditional Formatting OptionAs the name suggests, the conditional formatting option formats the selected range of data based on several conditions. In this example, it is used to find or highlight duplicate values. The steps to be followed are:
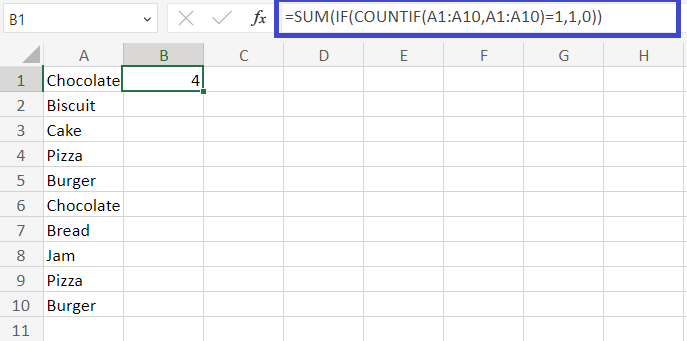
The unique values can also be highlighted by choosing the unique option. 4. Sum, If, and Count if FunctionCombining the Sum, if, and Countif functions are used to identify unique values. The syntax for the formula is: Example 1: Count the unique values using the Sum, if, and Countif formulas.
Working process of the formula The formula uses three functions: If, Count if, and Sum.
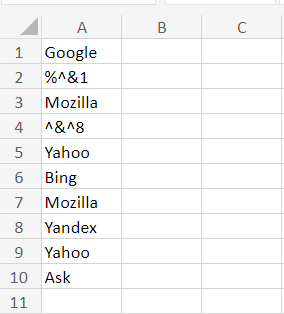
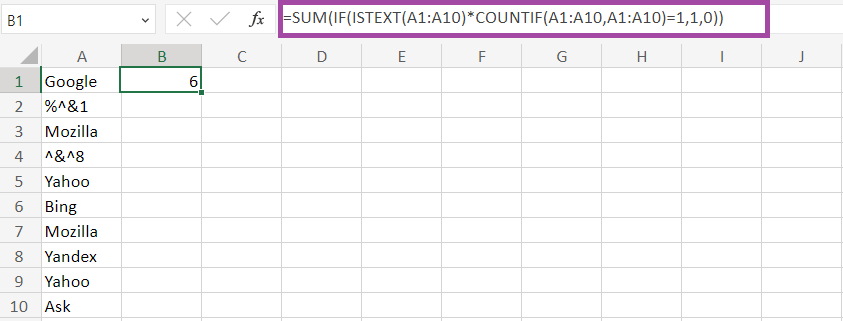
How to count the unique text values?Data entered by the user is a combination of Text and numeric values. Based on the requirement of the data, the unique values are counted. If the data contains a mixture of numeric and Text values, how to calculate the unique text values? The syntax of the formula used to count the unique text values is, Example: Count the unique text values from the given data
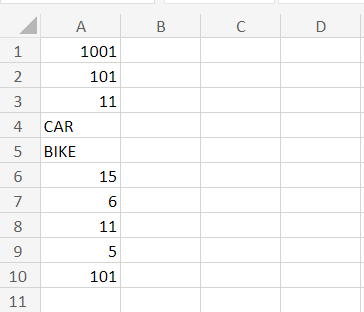
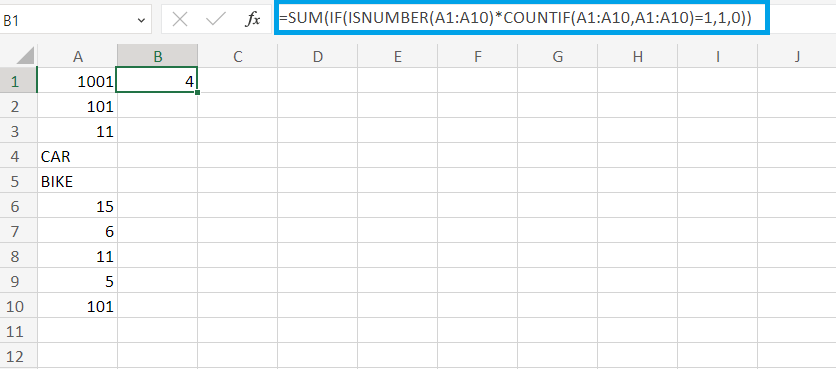
The formula returns the total unique value as 6 in the given data. Working process of the formula The ISTEXT function returns TRUE if the value is evaluated as Text and returns false if it doesn't contain Text. The If function returns the value as one if the data is Text and unique or it returns 0. The asterisk symbol (*) acts as an AND operator in the array formula. The Sum function adds all the values present in the array range. How to count unique numeric values in Excel?The unique numeric values can be counted using the specific formula if the data contains both Text and numeric values. The syntax of the formula is as follows, =SUM (IF (ISNUMBER (A1:A10)*COUNTIF (A1:A10, A1:A10) =1, 1, 0)) Example: Count the unique numeric value using the formula
The function returns the unique text value as 4 in the selected range of data. How to count case-sensitive data in Excel?The Text in the data contains both upper case and lower case. To count the unique values among the case-sensitive data, the formula used is as follows, =IF (SUM ((--EXACT ($A$2:$A$10, A2))) =1,"Unique","Dupe") This is used to check whether the given data is unique or dupe. To identify the number of unique values in the given data, the formula used is as follows, =COUNTIF (B2:B10,"unique") Example: Count the case-sensitive values in the given data.
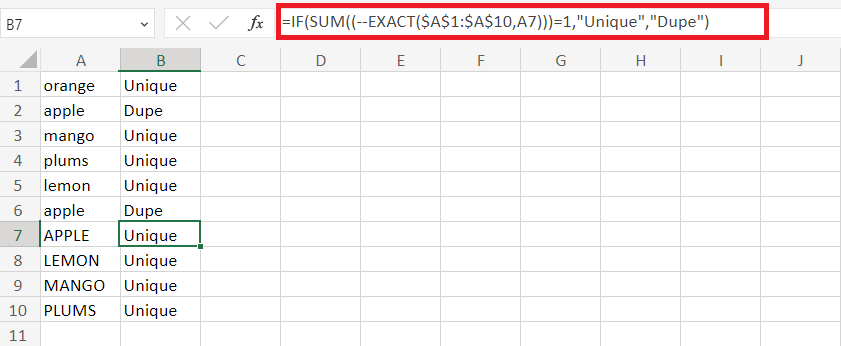
In the worksheet, the functions return each data unique or dupe. To count the results of the data quickly, the formula used is as follows, =COUNTIF (B1:B10,"Unique") Here B1:B10 is the cell range where the results are displayed.
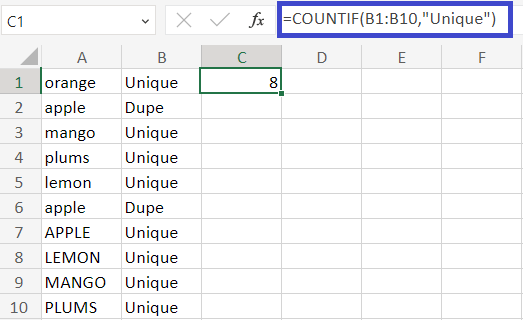
The Count if the function returns the Count of eight unique values in the data. Counting the first unique and first duplicate valuesWhile finding the unique values, the formula emits the first duplicate value in the data. To count both the unique and first duplicate values, the steps to be followed are:
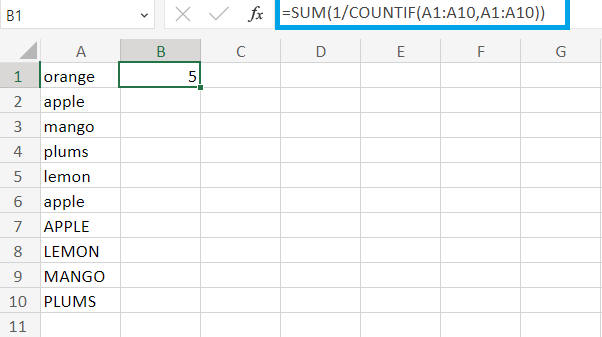
The function displays the five unique and 1st duplicate values. Another formula used is: =SUMPRODUCT (1/COUNTIF (A1:A10, A1:A10)) 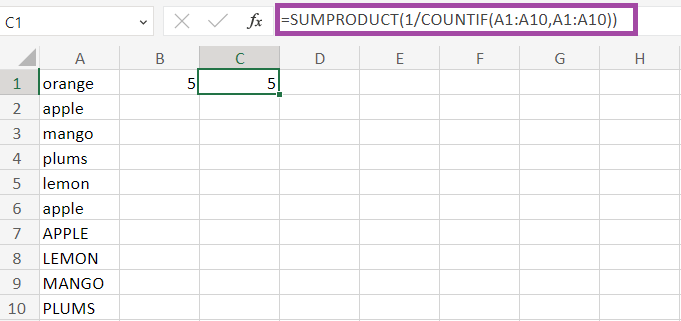
The Sum product function returns the unique and first duplicate value as 5. Working process of the formulaThe Count if function displays how often each data is repeated in the array format. Hence the array formula will be shown as follows, {1, 3, 2, 2, 2, 3, 2, 2, 2}. The array acts as a dividend with a divisor value of 1. Hence the result will be {1; 0. 3; 0.5; 0.5; 0.5; 0. 3; 0.5; 0.5; 0.5}. The duplicate values are converted into fraction numbers. When the fractional values are added, the result will be 1. The formula returns the Count of different values in the result. How to count distinct values in an empty cell?Sometimes the data contains characters, numbers, and empty cells. If the data contains empty cells, the formula to count distinct value is as follows: Example: Count the number of distinct values in the given data
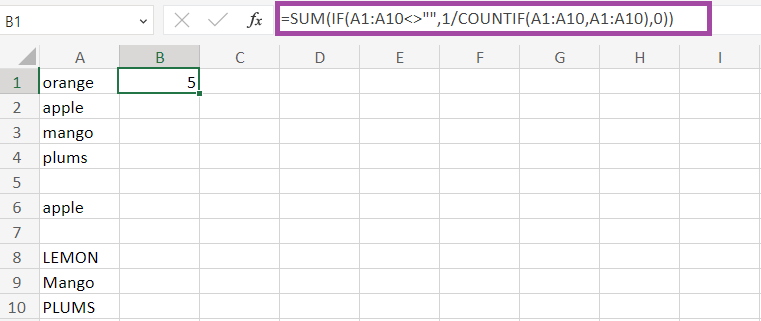
The null value is present in the data, and the function displays the Count of distinct values. Calculating unique and distinct rowsIf the data contains two rows, calculating the unique and distinct rows is done using the formula. Example: Calculate the unique and distinct rows in the given table To calculate the unique rows in the given data, the steps to be followed are,
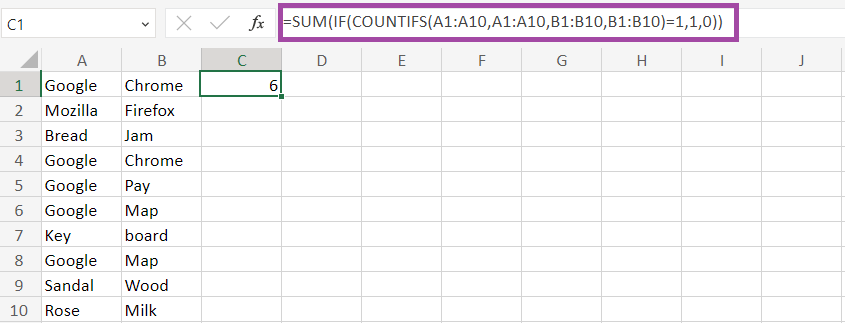
The function returns the unique rows as 6. The steps to find distinct rows are as follows:
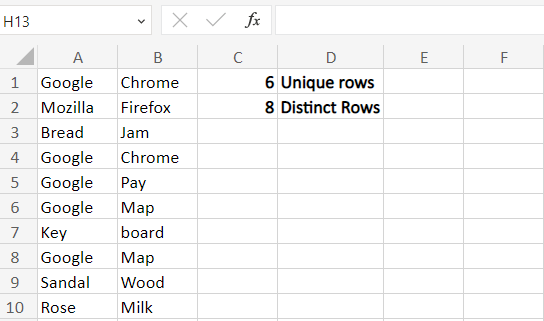
The formula calculates the distinct row as eight in the given data. SummaryThe usage of Microsoft Excel is increasing in every field. Finding unique and repeated is necessary to avoid incorrect data calculation and analysis. The different methods described in this tutorial are used to find the duplicated data. Based on the data, the formulas and functions are chosen. The different types of data include case-sensitive values, numeric values, zero values, etc. The data are categorized into unique and distinct values. The required Count of values is found in the given data using the necessary functions and formula.
Next TopicHow do you chart titles in Excel
|
 For Videos Join Our Youtube Channel: Join Now
Feedback
- Send your Feedback to [email protected]
Help Others, Please Share


