| |

Excel FORECAST.ETS.STAT functionStats and forecasting run hand in hand. However, there are numerous function in Microsoft Excel that helps to predict a future value based on the previous data. Wouldn't it be great if, along with the forecasting, we also get the statistical value related to forecasting? For that purpose, we have Excel have introduced Excel FORECAST.ETS.STAT function. In this tutorial, we will cover the definition of the FORECAST.ETS.STAT function, its syntax, parameter, error type and its reasons, and examples to comprehend how this formula returns a specified statistical value relating to a time series. What is Excel FORECAST.ETS.STAT function?"The FORECAST.ETS.STAT function in Excel returns a specified statistical value relating to a time series exponential smoothing forecasting." The Excel FORECAST.ETS.STAT function returns a particular statistical value related to time series forecasting with the FORECAST.ETS function. The statistic_type argument determines which statistic is returned by FORECAST.ETS.STAT. This Function works using the advanced machine learning algorithms, such as Exponential Triple Smoothing (ETS). Note: The Forecast.Ets.Stat function was added in Microsoft with Excel 2016. Therefore, if you are using an Excel version below Excel 2016, this function will be not available. It is also not available in Excel 2016 for Mac.Syntax
FORECAST.ETS.STAT(values, timeline, statistic_type, [seasonality], [data_completion], [aggregation])
ParameterValues (required) - This argument represents an array of historical known values corresponding to an array of dates/times. Timeline (required)- This parameter represents the independent array of dates/times, equivalent to each of the values. This must satisfy the following:
statistic_type (required)- This parameter represents a numeric value, signifying which statistical value is to be returned. This integer value must fall between the range 1 and 8, where each value returns the following:
Seasonality (optional): This argument indicates the algorithm should be used to detect seasonality in the data. Since its an optional parameter, it could be omitted as well. But if supplied, this parameter must be a positive integer between 0 and 8784, where the seasonality values indicate the following:
NOTE: A higher seasonality number will result in the #NUM! error.Data completion (optional) - This parameter represents how the algorithm should handle missing points in the timeline. Since it is an optional parameter, it could be omitted as well. But if supplied, this parameter argument can have the value 0 or 1 indicating the following:
Aggregation (optional)- This parameter specifies how the algorithm should aggregate values that have the same timestamp. Since it is an optional parameter, it could be omitted as well. But if supplied, this parameter argument can be any integer between 1 and 7 indicating the following:
ReturnThe FORECAST.ETS.STAF function returns a statistical value as a result of time series forecasting. ExamplesExample 1: Using the FORECAST.ETS.STATS function calculate the statistical value relating to this forecast.As you can see in the below table, we are given a monthly sales table for 2020, and based on the previous value, we have to forecast the sales figure for Jan 2021 and Feb 2021 (to predict the value use the existing FORECAST.ETS function). But as asked in the question, before predicting the values, we should know the statistical value relating to this forecast. 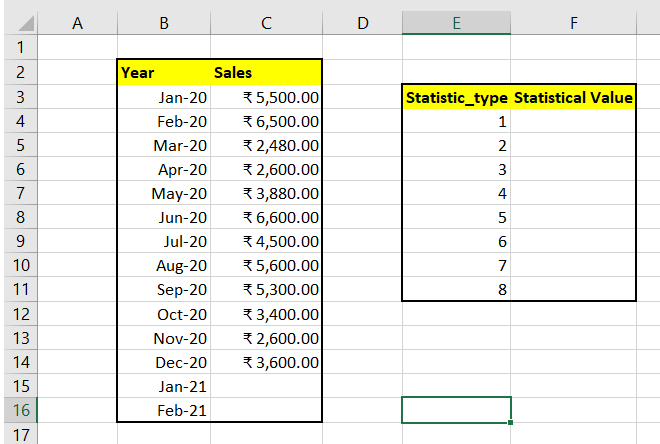
The Excel FORECAST.ETS.STAT function can be used to return statistical information relating to this forecast. To compute the statistical value related to a forecasting using the Excel FORECAST.ETS.STAT () function follow the below-given steps: STEP 1: Select the cell In the above question, we are already given a helper column to calculate the Statistical value. Therefore, we will select the first cell of this column, i.e., F4, to apply the FORECAST.ETS.STAT() formula. STEP 2: Type the FORECAST.ETS.STAT function To compute the statistical value for the given forecasted, we will use the inbuilt FORECAST.ETS.STAT() function. Therefore, start typing the function with the equal to (=) symbol followed by the pre-defined FORECAST.ETS.STAT function. Our formula will become: =FORECAST.ETS.STAT( 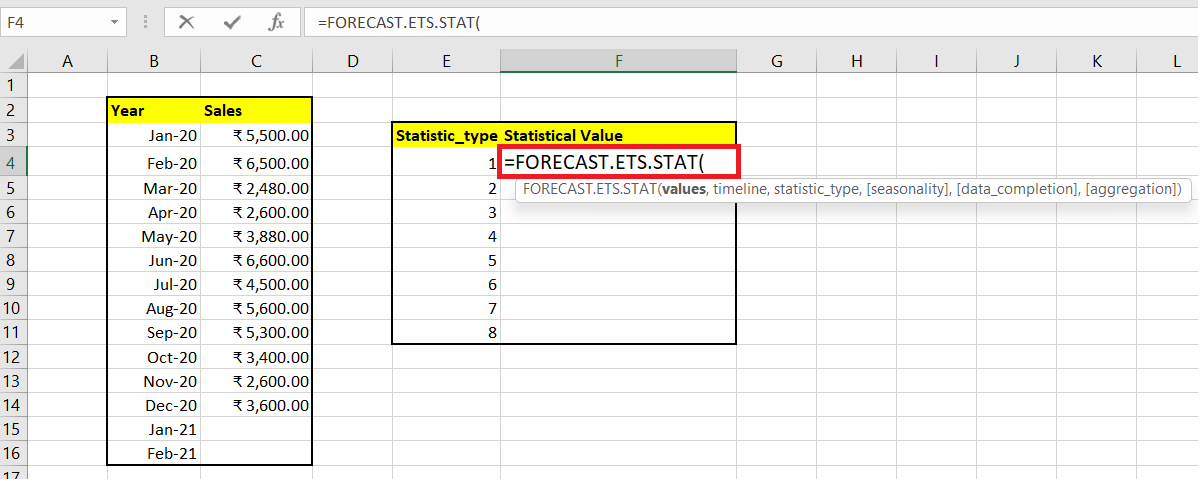
STEP 3: Supply the Parameters
Therefore, the overall formula becomes: =FORECAST.ETS.STAT($C$3:$C$14,$B$3:$B$14,E4) 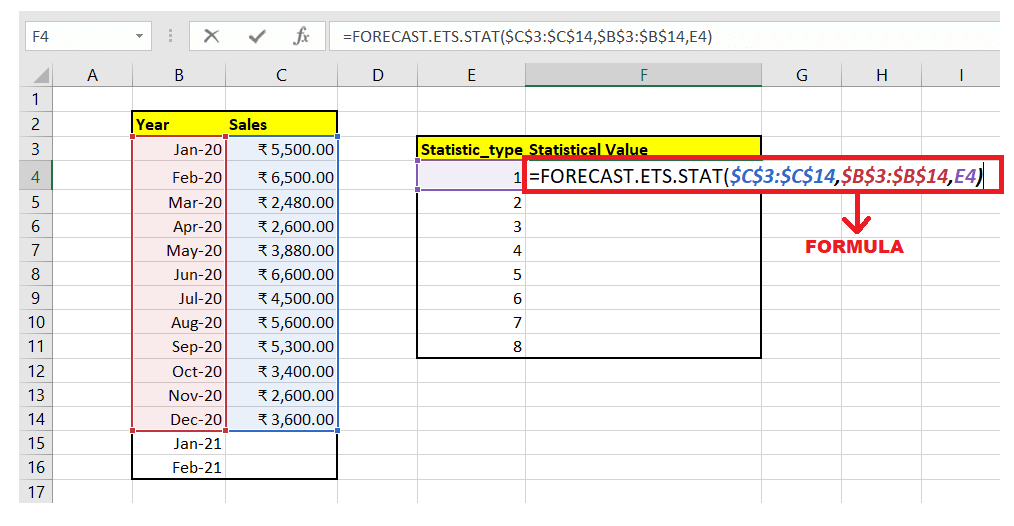
NOTE: Since we will copy the formula to other cells, therefore using the absolute cell references (like $C$3:$C$14) we have locked the cells to prevent them from changing their values when copying the formula to other cells.Step 4: The FORECAST.ETS.STAT function will return the output As a result, the FORECAST.ETS.STAT function will return a statistical value as a result of time series forecasting. 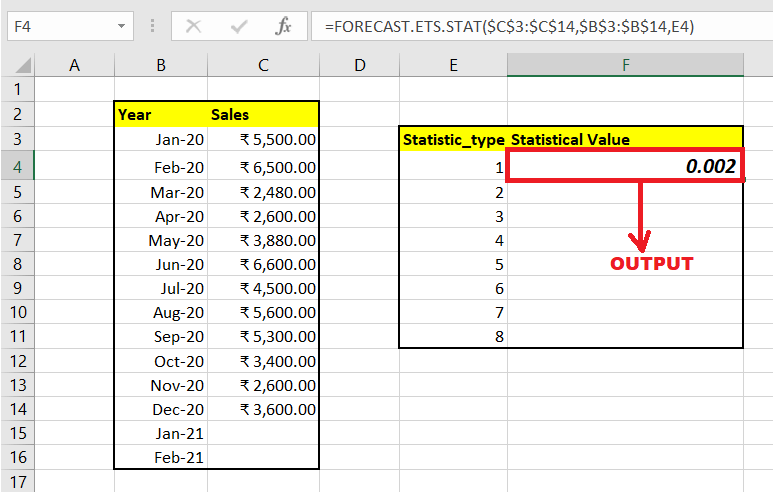
STEP 5: Drag the formula cell to replicate the formula Next, we will figure out the statistical values down the cell using the same formula. For the rest of the cells, the Values and Timeline parameter will be the same (therefore, we have used absolute references), only changing the statistical value. Select the F4 formula cell and move your cursor towards the right corner of the selected box. As a result, the cursor will change into a plus (+) icon. Drag the icon to the following cells, and your surprise formula will be replicated down the cells. You will have the following Statistical Values for different statistic_type. 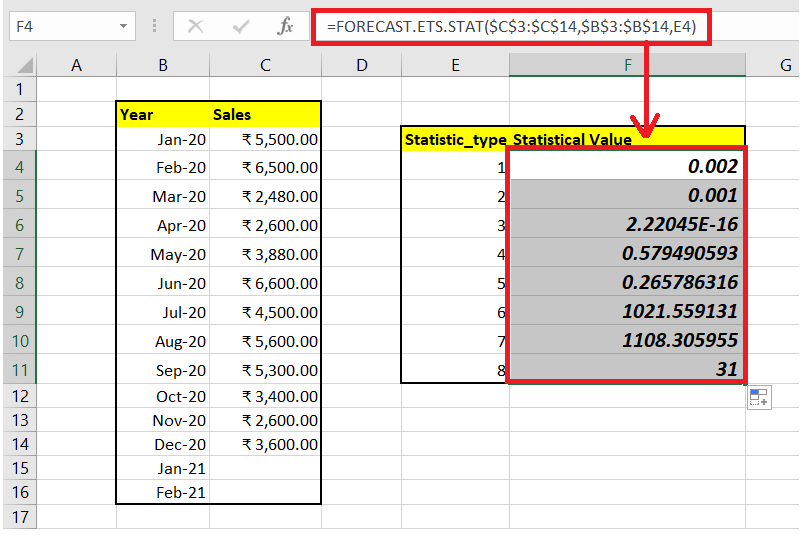
Very Well! Now, as we have learned how to use Excel FORECAST.ETS.STAT function, let's work on another example where this function is not working and throws an error. Example 2: Compute the statistical value if the statistic_type is not included in the range of 1-8.In the previous example, if you will notice, all the statistic_type values were given in between the range of 1-8. What if this range exceeds 8? In the below table, some of the values of our statistical_type do not fall in between the range of 1-8. Using the FORECAST.ETS function, let's figure the output. 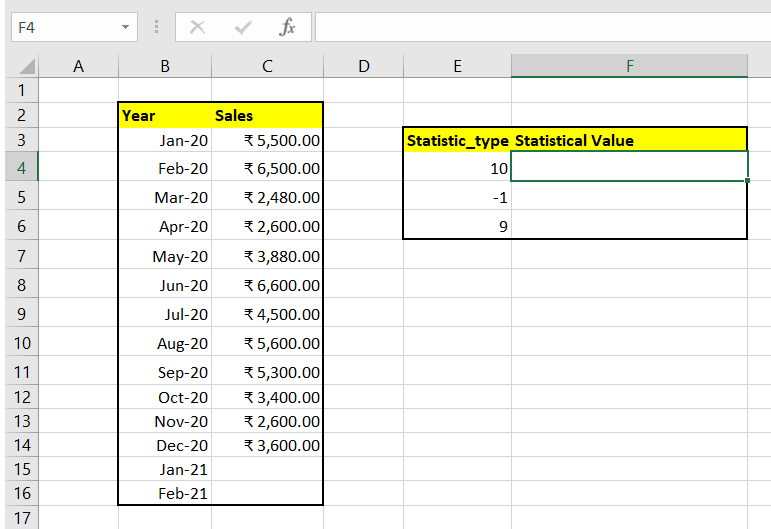
The Excel FORECAST.ETS.STAT function returns a #NUM error if the value for statistic_type is not within 1-8. To compute the statistical output for the above table following are the steps: STEP 1: Select the cell In the above question, we are already given a helper column to calculate the Statistical value. Therefore, we will select the first cell of this column, i.e., F4, to apply the FORECAST.ETS.STAT() formula. 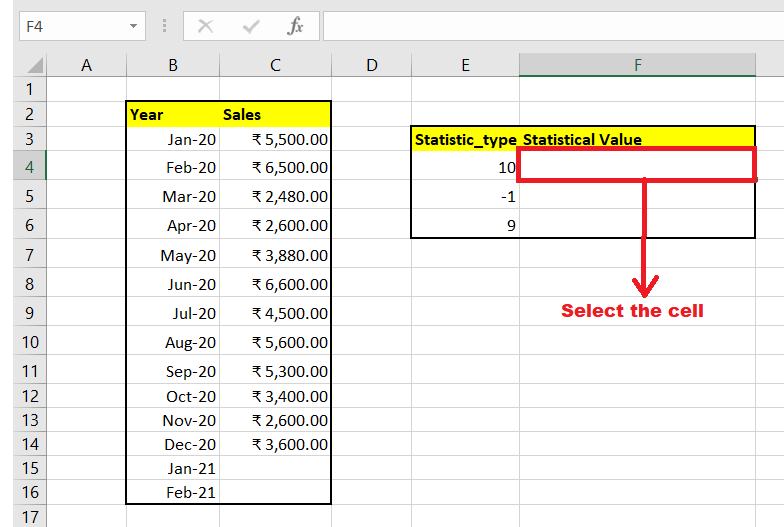
STEP 2: Type the FORECAST.ETS.STAT function To compute the statistical value for the given forecasted, we will use the inbuilt FORECAST.ETS.STAT() function. Therefore, start typing the function with the equal to (=) symbol followed by the pre-defined FORECAST.ETS.STAT function. Our formula will become: =FORECAST.ETS.STAT( 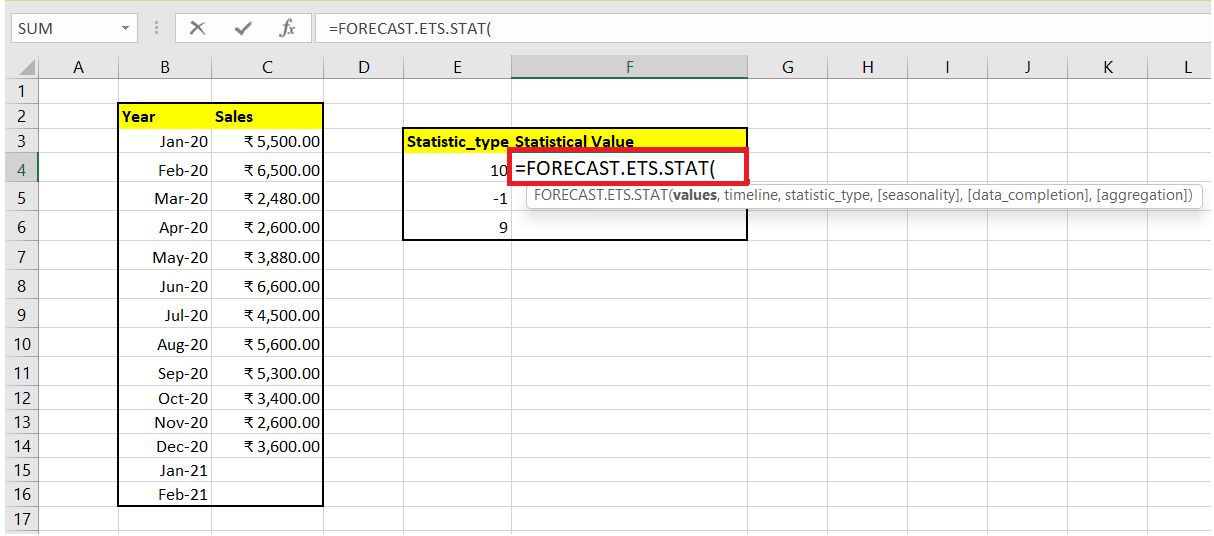
STEP 3: Supply the Parameters
Therefore, the overall formula becomes: =FORECAST.ETS.STAT($C$3:$C$14,$B$3:$B$14,E4) 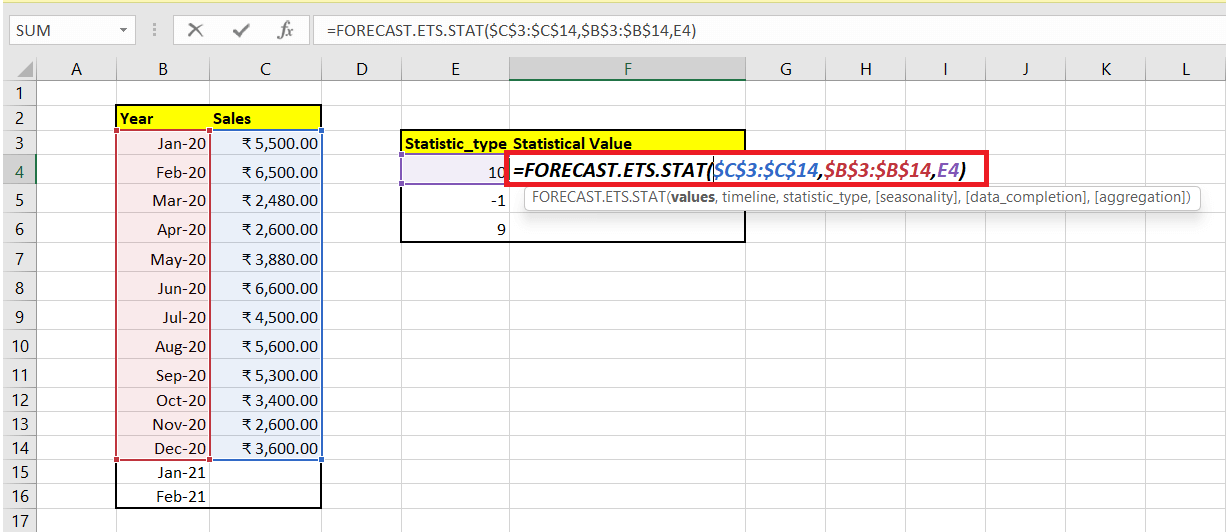
NOTE: Since we will copy the formula to other cells, therefore using the absolute cell references (like $C$3:$C$14) we have locked the cells to prevent them from changing their values when copying the formula to other cells.Step 4: The FORECAST.ETS.STAT function will return the output As a result, the FORECAST.ETS.STAT function will return the num! value error because the statistic_type parameter exceeds 8. 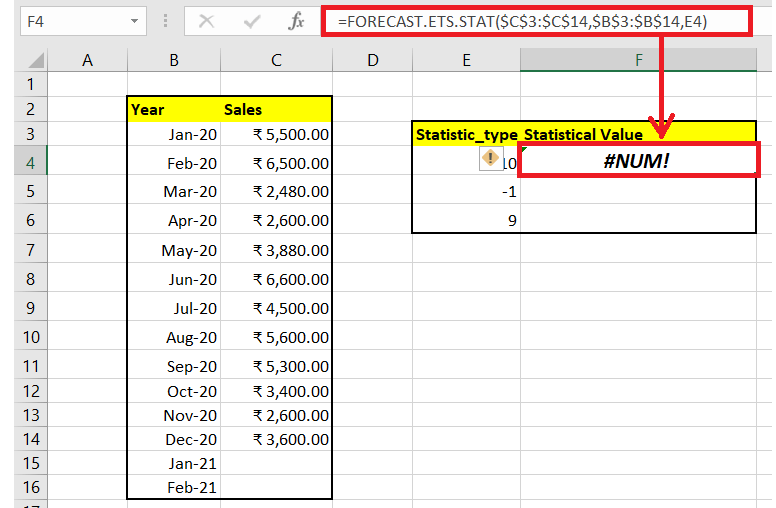
Points to Remember for Excel FORECAST.ETS.STAT functionThe FORECAST.ETS.STAT function has some key points that one should remember while working:
Next TopicExcel FORECAST.ETS.SEASONALITY function
|
 For Videos Join Our Youtube Channel: Join Now
Feedback
- Send your Feedback to [email protected]
Help Others, Please Share


