How to easily delete a Pivot Table in Microsoft Excel?It was well known that, in the Microsoft Excel the deletion of the pivot table is considered to be a fundamental task which in turn used for the purpose of managing our spreadsheet in an effective and efficient manner. And despite of their usefulness in the analysis of the data, the pivot tables can be sometimes clutter with our workbook or need to be replaced with the different analyses as well, and knowing them how to delete will ensures our spreadsheet to remains organized and also to be focused on the relevant data respectively. In this tutorial, we will be discussing about the general steps that are required for the purpose of deleting a pivot table in Microsoft Excel, and this will simplify our data management process and allow for the seamless transitions that exist between the different analyses as well. What is Pivot Table in Microsoft Excel?In Microsoft Excel a pivot table is usually considered as the powerful data summarization tool which can be efficiently used for the process of analyzing the huge datasets quickly. Despite of this, it will also enable the users to easily extract out the valuable insights from the available raw data by just organizing and summarizing it into a more manageable format. With the help of the pivot tables, the respective users can easily explore out the trends, patterns, and also the relationships that must lie within their data without the need for the complex formulas. Moreover at its core, the pivot table in Excel allows every user to effectively rearrange and also to manipulate out the data dynamically, and users can easily define rows, columns, as well as the values in order to structure their analysis according to the needs and criteria.
And despite all this, one of the key advantages that has been associated with the pivot tables is none other than their flexibility. With this advantage, the respective users can easily modify the layout and the structure of the pivot table in order to meet their analysis needs, as they can easily drag and drop out the fields from the dataset into the different areas of the pivot table, which are none other than rows, columns, values, and filters, for the purpose of creating custom reports and the summaries. This flexibility enables users to easily generate insights from the different perspectives and dimensions within the given set of data. However, the respective pivot tables are quite dynamic and interactive. They can automatically adjust to reflect changes in the underlying dataset, ensuring that users will always have access to the latest information. Users can also apply filters to group data. They can also sort values within the pivot table interface, thus enabling them to perform ad-hoc analysis and explore the specific subsets of data with more ease. What are the components of a Pivot Table in Microsoft Excel?The different components associated with the Pivot Table in Microsoft Excel, are as mentioned below: 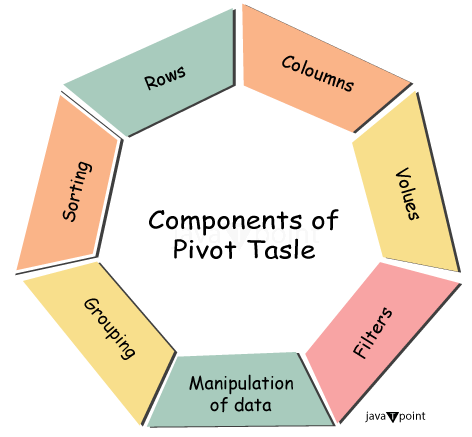
List out the reason for deleting Pivot Table in Microsoft Excel?It is well known that deleting a pivot table in Microsoft Excel is considered a common task that users may encounter for various reasons. Whether it is due to changes in the underlying data, modifications in the analysis requirements, or simply for cleanup purposes, knowing when and how to delete a pivot table is essential for the efficient management of the data and its analysis. 
1. Data Changes: One of the primary reasons for the purpose of deleting a pivot table is when the underlying data has undergone significant changes. Microsoft Excel pivot tables are dynamic and get updated automatically when any changes are made to the source data. However, if in case the changes are substantial or if in case we are actually working with a completely different dataset, then in it that case it may be more practical to delete the existing pivot table and also create a new one based on the updated data.
2. Modification in the Layout: One of the other important reasons to delete a pivot table is none other than to modify its layout as well as its structure. Pivot tables usually offer flexibility in how data is mainly organized and summarized, thus allowing users to easily customize rows, columns, and values and filter out the data based on their analysis requirements. Ifsuppose, we need to change the layout in order to focus on the different dimensions or the metrics. In that case, deletion of the existing pivot table provides a clean slate for the purpose of efficiently creating a new one with the desired layout. For instance, if we initially analyzed the sales data by the category of the product, but now we need to pivot the analysis in order to analyze the sales by region, and deleting of the existing pivot table as well, and create a new one focused on the regional sales is the appropriate action respectively. 3. Cleanup: It was well known that, as Microsoft Excel workbooks become more complex with multiple sheets, charts, as well as with the pivot tables, and despite this it is very much essential to keep them organized and in a clutter-free manner. Deletion of the unnecessary pivot tables that are no longer relevant to our analysis helps to declutter our respective worksheets and improve readability. It also streamlines the workbook and makes it easier for the purpose of navigating and understanding, especially while sharing the file with others. More often the regular cleanup of the unused pivot tables contributes to better performance and thus reduces the risk of errors as well as confusion while working with the workbook. 4. Correction of the Error: In some cases, errors may occur in the pivot table due to issues related to the data sources, calculations, or formatting as well. If we try to troubleshoot and correct the errors within the existing pivot table but are unsuccessful, deleting it and starting fresh is the necessary step. However, deleting the problematic pivot table merely allows us to identify and also to address the underlying issues, whether they are related to the integrity of the data, formula errors, or the formatting inconsistencies respectively. 5. Performance Improvement: Microsoft Excel workbooks with multiple pivot tables, large datasets, or complex calculations can sometimes experience various performance issues. The deletion of the unnecessary pivot tables that are no longer needed or are duplicative can help us to improve the performance of the workbook effectively. By just reducing the computational load as well as the memory usage, deleting unused pivot tables can now contribute to smoother navigation and faster response times while working with the workbook, respectively. What are the basic steps required to delete a Pivot Table in Microsoft Excel?The basic steps that can be easily required to delete a Pivot Table in Microsoft Excel are as follows:
So by just following all these step-by-step instructions in the sequential manner, we can quickly and efficiently delete pivot tables in the Microsoft Excel, thus helping us to manage our data analysis projects with the ease. Method used for the deletion of a Pivot Table in Microsoft Excel?It is very simple and easy to use. Let's now understand how to delete the Pivot Table in Microsoft Excel using the following Methods. #Method 1: Removing the Pivot table by just copying and Pasting as the Values.Now, in this particular method, we can easily remove or delete the Microsoft Excel pivot table in two different ways: Step 1: First of all, we are required to select the pivot table range. 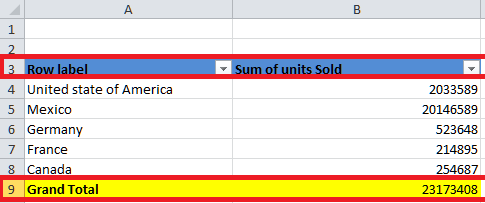
Step 1.1: We can also select the pivot table like this. Just place a cursor inside the pivot table and then go to Options. After that, click on the option to select the Entire Pivot Table. 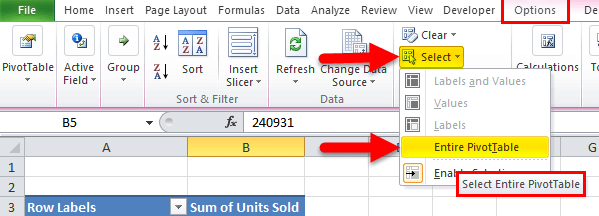
Step 2: Now, in this step, we are required to press Ctrl + C in order to copy down the data once the pivot table is selected respectively. 
Step 3: We do not change our cursor once we have copied down the pivot table. After that we need to press ALT + E + S, as this would instantly open up the Paste Special dialogue box. Then we are required to select the values from here and then need to click on the "OK" option respectively. 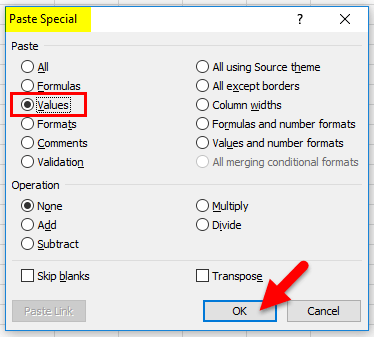
Step 4: Now, the pivot table data is pasted as values. An Excel pivot table is removed successfully. 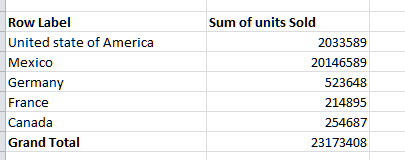
More often, if we closely observe all the formatting, such as background color, font style, font name, and even the pivot table fields, they are removed from the list in Microsoft Excel. #Method 2: Remove the pivot table by using Clear OptionNow, for the purpose of removing the pivot table by making use of the clear option, we need to follow the below-mentioned steps: Step 1: First of all, we are required to select the pivot table range. 
Step 1.1: In this step, we are required to select the pivot table as follows: Place a cursor just inside the pivot table, go to "Options," move our cursor to select an option, and then go to the "Entire Pivot Table," respectively. 
Step 2: Once we have selected the pivot table range, then we need to click on the delete option in order to delete or remove the Excel pivot table respectively. Step 2.1: Once we have selected the pivot table range, then need to go to Options > Clear > Clear All. 
This will remove only the existing pivot table fields, but the sheet with the pivot table options to drag and drop will remain the same. 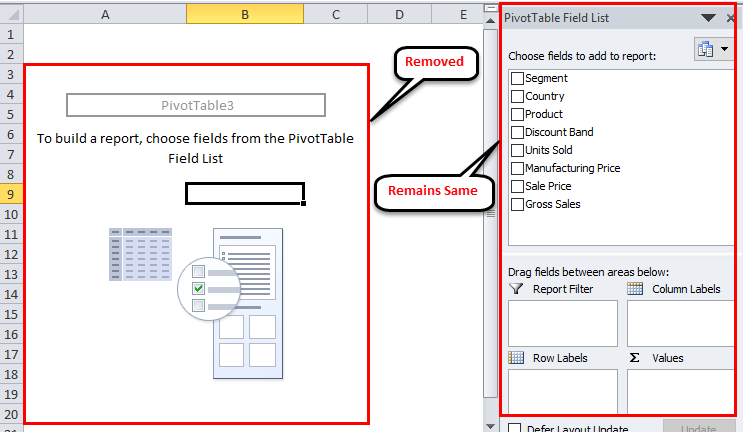
#Method 3: Delete All Pivot Tables in One ShotWe have learned about the easy way of removing and deleting pivot tables in Microsoft Excel. But, deleting many pivot tables in a workbook is a challenge. We are required to have the VBA code to remove the pivot table. We have already written the VBA code to delete all the existing pivot tables in the workbook. Then, we need to copy and paste the code below into our VBA module, and then we must save the workbook as a macro-enabled workbook. Step 1: For this example, we are first required to open the VBA editor by pressing the ALT + F11 shortcut button from our respective locations. 
Step 2: In this step, we are required to go to the "insert option" and then click on the "Module option." 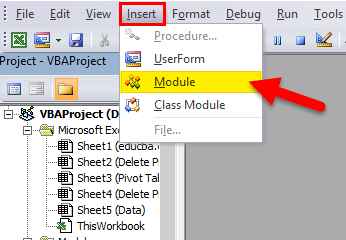
Step 3: Once the module is inserted, then after we need to copy and paste out the above code and save the workbook as a macro-enabled workbook. 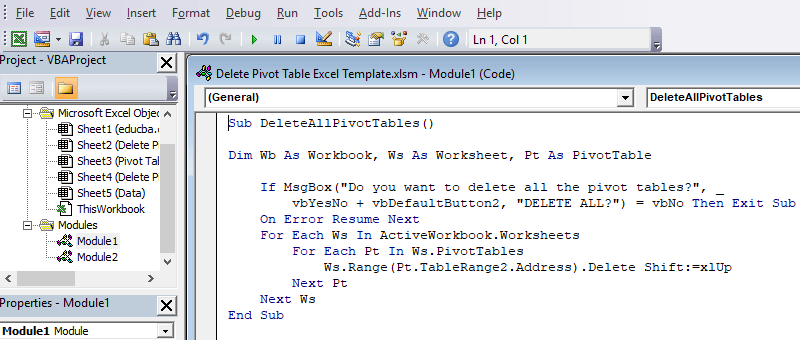
List out the various advanced features that are associated with the Pivot table in Microsoft Excel?The various advanced features in association with the respective Pivot table in Microsoft Excel are as follows: 1. Pivot Charts: The Pivot charts in Microsoft Excel are termed to be one of the powerful features which allow users to create visual representations of the pivot table data directly within the selected Excel sheet. And by just linking out the pivot charts to the respective pivot tables, the respective users can now dynamically update charts as they want to interact with the pivot table, and thus providing an effective visual aid for the analysis of the data. Despite of all this, Microsoft Excel usually offers different chart types, that are none other than the line charts, pie charts and also the bar graph which allows users to choose out the most suitable visualization for their data. Pivot charts enable users to identify the trends, patterns, and outliers more effectively, enhancing the overall understanding of the data in an effective manner. 2. Refreshing of the Data: One of the key advantages of the pivot tables is none other than their dynamic nature. They automatically update to reflect the changes in the underlying dataset as well, which means that if any new data is added, then the existing data will get modified, or data will get removed; the pivot table can be refreshed in order to incorporate all these changes efficiently. The refresh process usually ensures that the analysis remains current and accurate, thus providing users with up-to-date insights without any need for manual intervention. Microsoft Excel provides various options for refreshing data including manual refresh, automatic refresh at specified intervals, as well as the refreshing of the data based upon the opening of the workbook. 3. Connections of the data: Pivot tables in Microsoft Excel can be easily connected with the various external data sources, such as databases, SharePoint lists, and other Microsoft Excel workbooks respectively. As this feature enables out the particular users to easily perform out the real-time analysis of the data without having to import the data into the Excel sheet. Though by establishing a connection to the external data sources, users can now easily create pivot tables that will automatically retrieve and can easily analyze the data directly from its source. 4. Conditional Formatting: It was well known that the respective conditional formatting primarily allows users to apply the formatting rules to the selected cells that are available within a pivot table and based upon the specific conditions and also the criteria. This feature will help us to highlight the important information, helps in identifying the trends, and also to draw attention to the outliers and also the exceptions within the underlying data. Despite of all this, users can now easily customize the conditional formatting rules in order to apply the different formatting styles, such as font color, background color, font style, and also the data bars, that are based upon the values of the data. And by making use of the conditional formatting in the pivot tables, the respective users can make their analyses more visually appealing and easier to interpret, and thus enhancing out the overall effectiveness of their data analysis efforts. What should be remembered while working with the deletion of the Pivot Table in Microsoft Excel?It is well known that deleting a pivot table in Microsoft Excel is straightforward, but some important things need to be remembered to ensure that we do it correctly.
However, deleting a pivot table in the Microsoft Excel mainly involves selecting out the entire pivot table, right-clicking to access the delete option, thus confirming the deletion, and then verifying that the respective pivot table has been successfully removed. It is quite essential to understand the implications of deleting out the pivot table and to take precautions like as backing up our data before making any significant changes. ConclusionIt was concluded that the process of deleting a pivot table in Microsoft Excel usually stands as the pivotal moment, which are akin to the act of just tidying up one of the workspaces after effectively completing a task. As it will embodies the essence of efficiency realted to the specific organization, and thus allowing users to easily streamline their management processes that are quite related to the data. In order to initiate the deletion of a pivot table in Excel sheet, one must needs to select out the table itself; it was much like identifying a specific set of the documents on a cluttered desk respectively. This deliberate action signals to the Microsoft Excel in order to focus on the targeted data segment. Once singled out, the deletion can be easily executed through one of the two primary methods as well: pressing out the delete key or right-clicking on the table in order in order to access the delete option from the respective contextual menu. And all these actions are reminiscent of discarding unneeded papers or files and swiftly removing them from the spreadsheet canvas. In the event of a prompt for the confirmation, users are encouraged in order to validate out their decision, akin to the final check before disposing of the items permanently. This will ensure intentional action and prevent accidental deletions. Upon completion, saving the workbook preserves the changes made, akin to putting away neatly organized documents back into the drawer for future reference. Moreover, deleting a pivot table in Microsoft Excel will not only declutter the workspace but also helpful in fostering a sense of the clarity and focus. By removing extraneous elements, users can now direct their attention to the essential data as well as the analysis, enhancing productivity and also the decision-making processes. It mainly embodies the principle of 'less is more,' thus enabling users to easily navigate their spreadsheets with the greater ease and the efficiency. In essence, the act of deleting a pivot table will now underscores the importance of maintaining an organized digital environment, facilitating smoother workflows and also optimized the effective management of the data practices.
Next TopicHOW TO DELIMIT IN EXCEL
|
 For Videos Join Our Youtube Channel: Join Now
Feedback
- Send your Feedback to [email protected]
Help Others, Please Share


