| |

Excel FORECAST.ETS FunctionForecasting based on the series of known data values are very important. It benefits the users to predict numeric data such as sales, inventory, expenses, etc. To conclude this, Microsoft introduced the FORECAST.ETS function with the version of Excel 2016. In this tutorial, we will cover the definition of the FORECAST.ETS function, its syntax, parameter, error type and its reasons, and examples to comprehend how this formula returns a specified statistical value relating to a time series. What is FORECAST.ETS Function?"The FORECAST.ETS in an inbuilt Excel function that is used to compute the exponential smoothing forecasts based on a series of existing data values." In other words, this function forecasts a value based on known values that follow a seasonal trend. The FORECAST.ETS predicts a future value based on the AAA (where it stands for additive error, additive trend and additive seasonality) version of the Exponential Triple Smoothing (ETS) algorithm. Therefore, this function is named as ETS. The ETS algorithm smoothes out irrelevant deviations in known data trends by detecting seasonality patterns and confidence intervals. Note: The FORECAST.ETS function was added in Microsoft with Excel 2016. Therefore, if you are using an Excel version below Excel 2016, this function will be not available. It is also not available in Excel 2016 for Mac.Syntax
FORECAST.ETS(target_date, values, timeline, [seasonality], [data_completion], [aggregation])
ParameterTarget_date (required) - This argument represents the data point for which to forecast a value. It can be represented by a date/time or number. Values (required) - This argument signifies a range or array of historical data for which you want to predict future values. Timeline (required) - This parameter represents an array of dates/times or independent numeric data with a constant step between them. Seasonality (optional): This argument indicates the algorithm should be used to detect seasonality in the data. Since its an optional parameter, it could be omitted as well. But if supplied, this parameter must be a positive integer between 0 and 8784, where the seasonality values indicate the following:
NOTE: A higher seasonality number will result in the #NUM! error.Data completion (optional) - This parameter represents how the algorithm should handle missing points in the timeline. Since it is an optional parameter, it could be omitted as well. But if supplied, this parameter argument can have the value 0 or 1 indicating the following:
Aggregation (optional)- This parameter specifies how the algorithm should aggregate values that have the same timestamp. Since it is an optional parameter, it could be omitted as well. But if supplied, this parameter argument can be any integer between 1 and 7 indicating the following:
Points to Remember- FORECAST.ETS
ExamplesExample 1: Using the FORECAST.ETS function predicts the sales based on given values that follow a seasonal trend.As you can see in the below table, we are given a monthly sales table for 2020, and based on the previous value, we have to forecast the sales figure for Jan 2021 and Feb 2021 to predict the value use the existing FORECAST.ETS function. 
The Excel FORECAST.ETS function predicts a value based on known values that follow a seasonal trend. To compute the future sales value using the Excel FORECAST.ETS () function follow the below-given steps: STEP 1: Select the cell In the above question, we have introduced a helper column to predict the sales value. Therefore, we will select the first cell of this column, i.e., D15, to apply the FORECAST.ETS() formula. 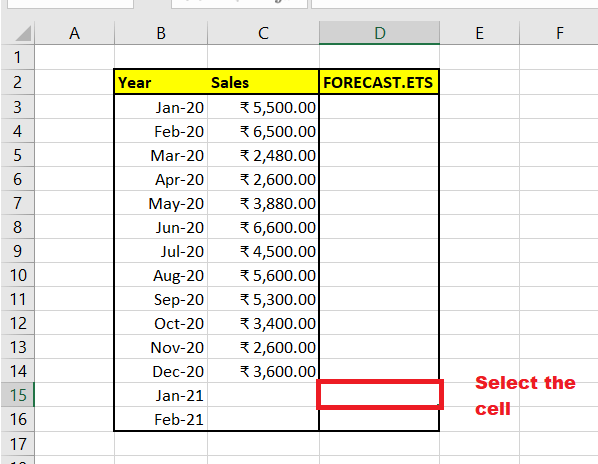
STEP 2: Type the FORECAST.ETS.STAT function To predict the sales value for the given seasonal trend, we will use the inbuilt FORECAST.ETS() function. Therefore, start typing the function with the equal to (=) symbol followed by the pre-defined FORECAST.ETS function. Our formula will become: =FORECAST.ETS( 
STEP 3: Supply the Parameters
Therefore, the overall formula becomes: =FORECAST.ETS(B15,$C$3:$C$14,$B$3:$B$14) 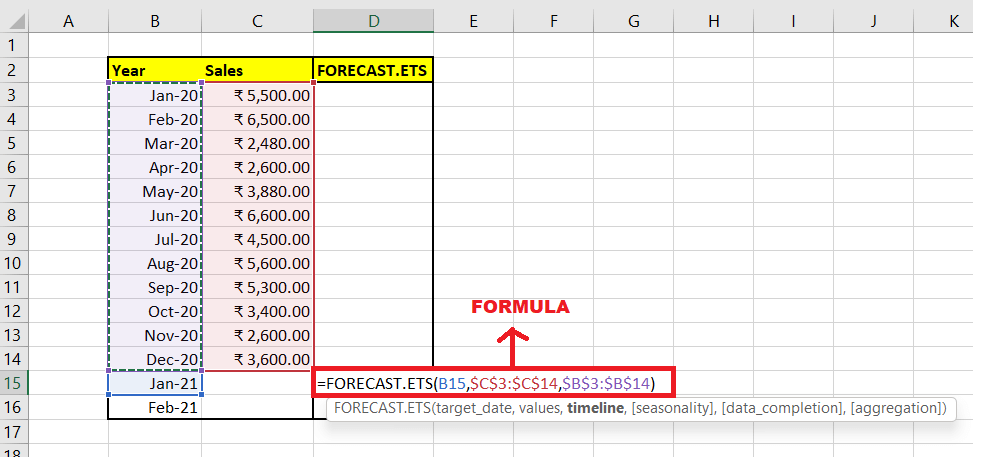
NOTE: Since we will copy the formula to other cells, therefore using the absolute cell references (like $C$3:$C$14) we have locked the cells to prevent them from changing their values when copying the formula to other cells.Step 4: The FORECAST.ETS function will return the output As a result, the FORECAST.ETS.STAT function will forecast the future sales values for Jan-21. 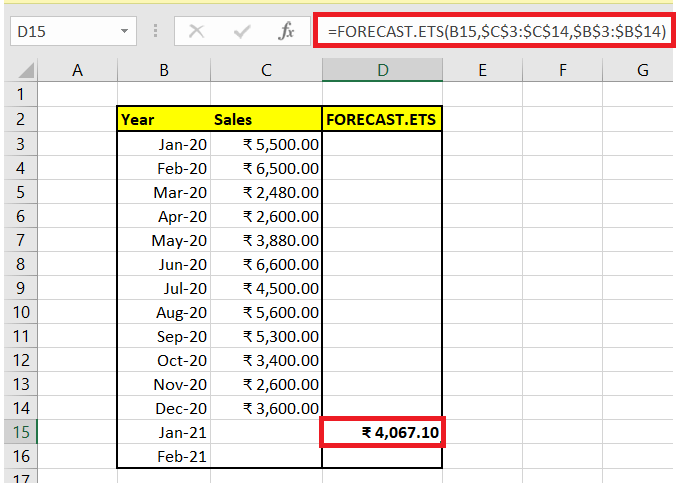
STEP 5: Drag the formula cell to replicate the formula Next, we will predict the sales values for more date values using the same formula. For the rest of the cells, the Values and Timeline parameter will be the same (therefore, we have used absolute references), only changing the date parameter. Select the F4 formula cell and move your cursor towards the right corner of the selected box. As a result, the cursor will change into a plus (+) icon. Drag the icon to the following cells, and your surprise formula will be replicated down the cells. You will have the following Statistical Values for different statistic_type. 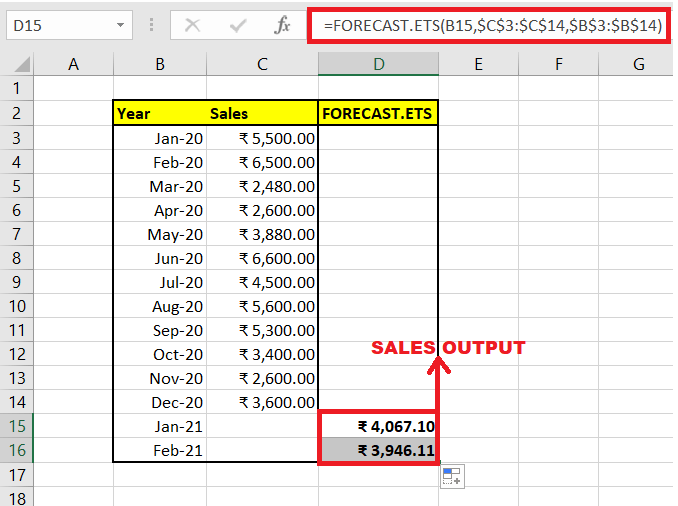
Step 6: Make a graph for predicted Sales Next, we will depict the output visually using a graph. Select the data, go to insert-> charts-> line charts. Excel will create a detailed linear regression forecasting chart. Refer to the below output. 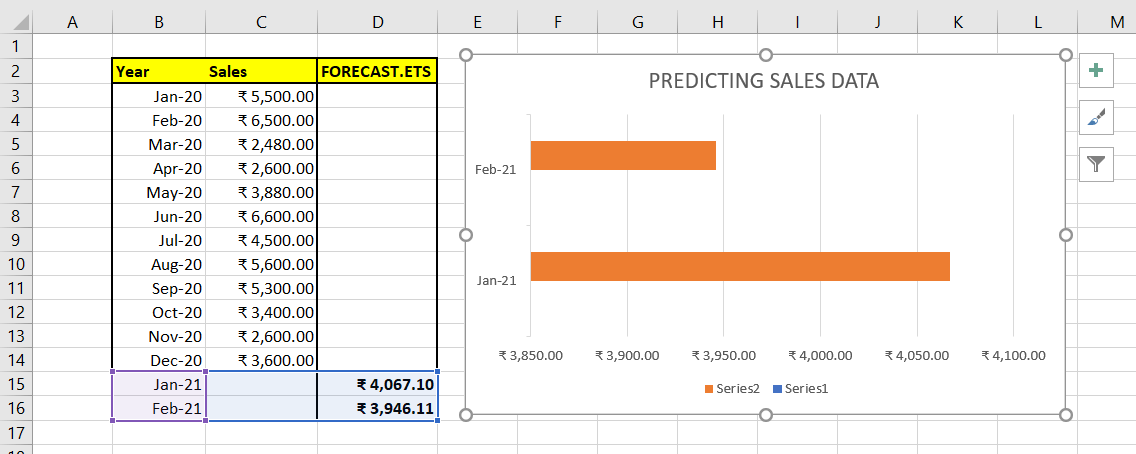
Eureka! using the inbuilt Excel FORECAST.ETS function in the above excel table, wehave successfully forecasted the future sales values for two months. #FORECAST.ETS Example 2: Calculate the future value if the values and timeline arguments are not the same size.The FORECAST.ETS function returns the #VALUE! error if values and timeline arguments are not the same size. Let's understand this using the below given data. 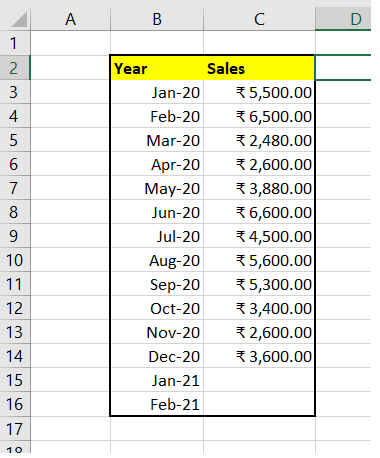
Follow the below-given steps to analyse the output of the FORECAST.ETS() function if values and timeline arguments are not the same size: STEP 1: Select the cell In the above question, we have introduced a helper column to predict the sales value. Therefore, we will select the first cell of this column, i.e., D15, to apply the FORECAST.ETS() formula. 
STEP 2: Type the FORECAST.ETS.STAT function To predict the sales value for the given seasonal trend, we will use the inbuilt FORECAST.ETS() function. Therefore, start typing the function with the equal to (=) symbol followed by the pre-defined FORECAST.ETS function. Our formula will become: =FORECAST.ETS( 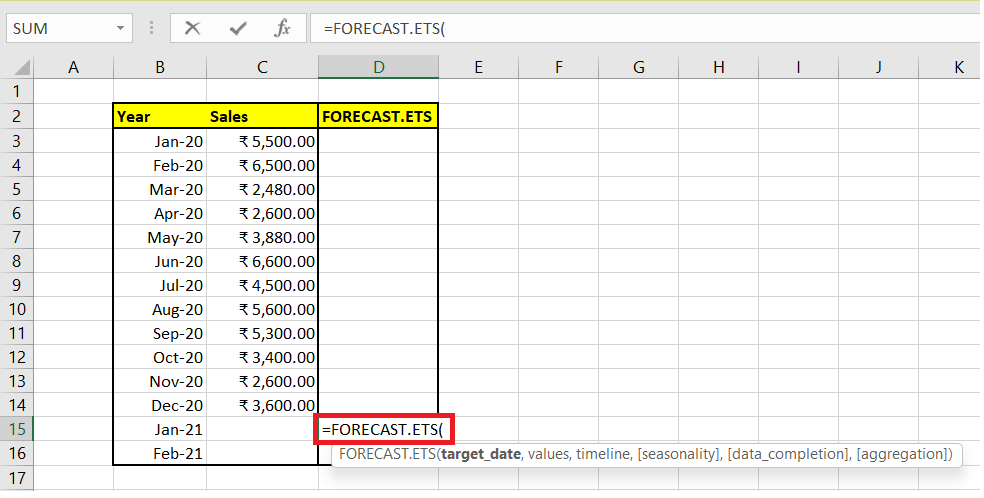
STEP 3: Supply the Parameters
Therefore, the overall formula becomes: =FORECAST.ETS(B15,$C$3:$C$14,$B$3:$B$16) 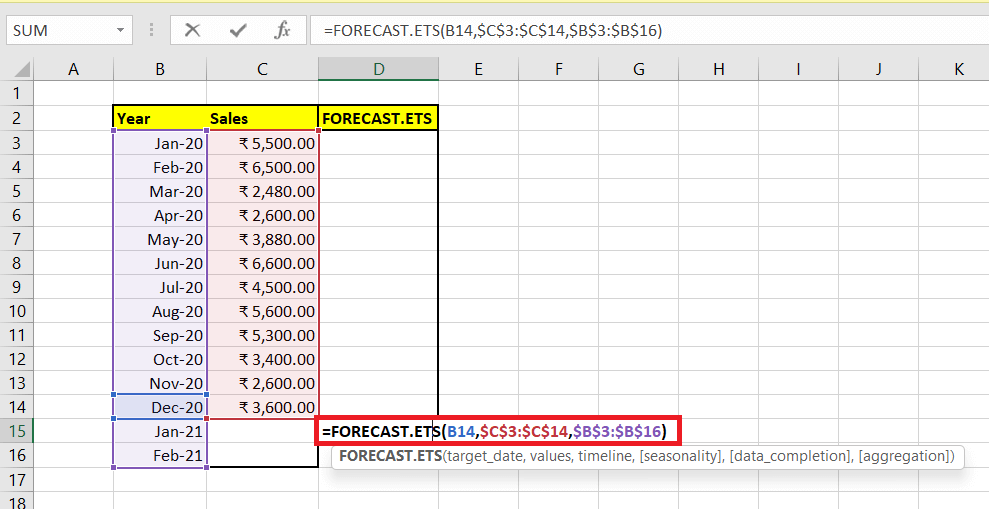
NOTE: Since we will copy the formula to other cells, therefore using the absolute cell references (like $C$3:$C$14) we have locked the cells to prevent them from changing their values when copying the formula to other cells.Step 4: The FORECAST.ETS function will return the output As a result, the FORECAST.ETS.STAT function will return an #N/A error because the size of timeline is greater than the Values parameter. 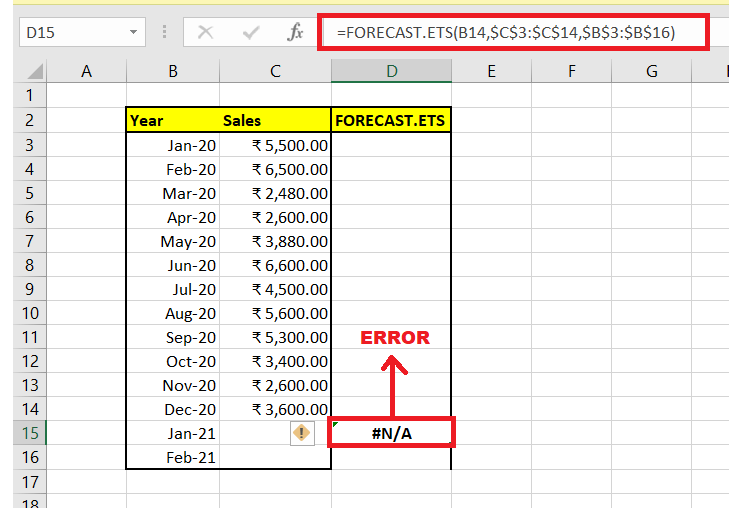
Excel FORECAST.ETS function not workingSometimes while working the Excel FORECAST function can throw an error, it could most likely be because of the following reasons:
Next TopicExcel FORECAST.ETS.STAT function
|
 For Videos Join Our Youtube Channel: Join Now
Feedback
- Send your Feedback to [email protected]
Help Others, Please Share


