| |

How one can easily create a chart (graph) in Microsoft Excel and save it as TemplateWe all know that every individual needs to create a graph in Microsoft Excel to visualize the data or check the latest trends. Microsoft Excel usually provides a wealth of powerful chart features, but it may require help locating the necessary options. Though we have a good understanding of the different chart types and the data types they are appropriate for, we may spend hours fiddling with the different chart elements and yet end up creating a graph that bears only a remote resemblance to what we have pictured in our mind. Besides, this chart tutorial starts with the basics and walks us through the step-by-step process of making a chart in Microsoft Excel. And even if we are a beginner with little to zero experience, we can also create our first Microsoft Excel graph in minutes and make it look exactly how we figured it out in our minds.
Let's get started ! What is the basis of the Microsoft Excel chart?In Microsoft Excel a chart is also termed to be a graph which is defined as a graphical representation of numeric data, in which the all the respective data is represented by various symbols like as bars, columns, lines, etc. Furthermore, it is much more common to make graphs in Microsoft Excel for a better understanding of the large amounts of data or the relationship between the different data subsets efficiently. And Microsoft Excel usually lets us create many different graph types like Line charts, Bar charts, Column charts, Pie charts, Area charts, Bubble charts, Radar charts, Surface charts, and Pivot charts. 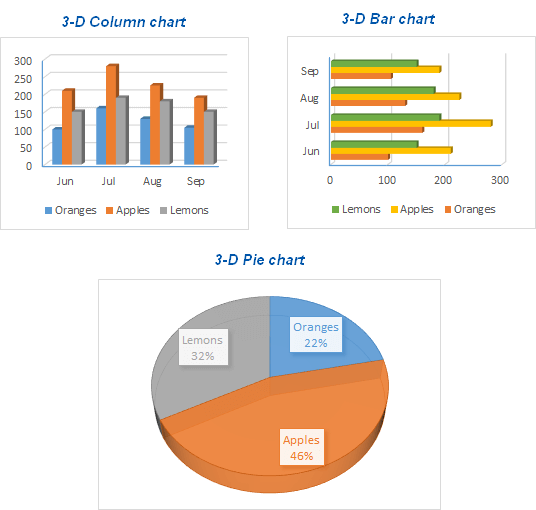
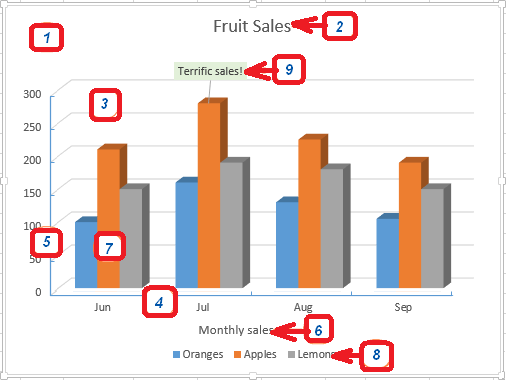
And the Excel charts have a handful of the elements, in which some of the elements are primarily displayed by default; and left over elements can be added as well as modified manually as per our requirement:
How can one easily make a chart in Microsoft Excel?While creating a graph in Microsoft Excel, we can easily select from various chart types to present our data most meaningfully to our users and irrespective of this one can also create a combination graph by just making use of the several chart types. And in order to create a chart in Microsoft Excel, we will be entering the numeric data on a given worksheet, and then continue with the below mentioned steps: 1. Preparing the data to be plot in a given chartWe all know that, for most of the Microsoft Excel charts, like as bar charts or column charts, no other special data arrangement is required, and we can also organize the data in the form of rows or columns, and Microsoft Excel will then automatically determine out the best method to plot the data in our graph. And for make a good-looking Microsoft Excel chart in an Excel sheet, the following points must be kept in mind:
And in this example, we are going to make use of a graph which is based on the following table respectively: 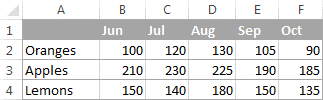
2. Selecting the data to include in the chartIn this step, we will first select all the data we want to include in our Excel graph, and we are required to select the column headings if in case we want them to get appear in the chart legend or axis labels.
Note: It should be noted that to select all used cells on the given worksheet, we will be placing the cursor in the first cell of the used range (we will press the Ctrl+Home shortcut to get to cell A1) and then again, we will be pressing out the Ctrl + Shift + End shortcut from our keyboard to extend the selection to the last used cell .3. Inserting the chart in the Microsoft Excel worksheetNow in this step, in order to add the graph to the current sheet, we need to go to the Insert tab > Charts group, and then we will click on a chart type we want to create. Now in the Microsoft Excel version 2013 or in higher versions of Excel, we can click on the Recommended Charts button for getting a view of a gallery of pre-configured graphs that will best match with the selected data. 
In this example, we are about to create a 3-D Column chart, and to achieve this we will be clicking on the arrows which are next to the Column Chart icon as well as choosing one of the charts sub-types present under the 3-D Column category. 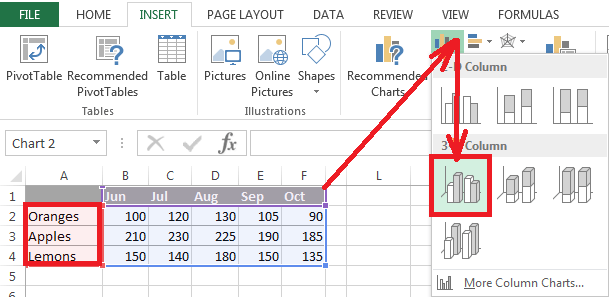
And for more chart types, we will be clicking on the More Column Charts... link, which is usually present at the bottom. The Insert Chart dialog window will get appears on our screen, and from that we can see a list of available column chart sub-types at its top. We can also choose other graph types on the left-hand side of the dialog: 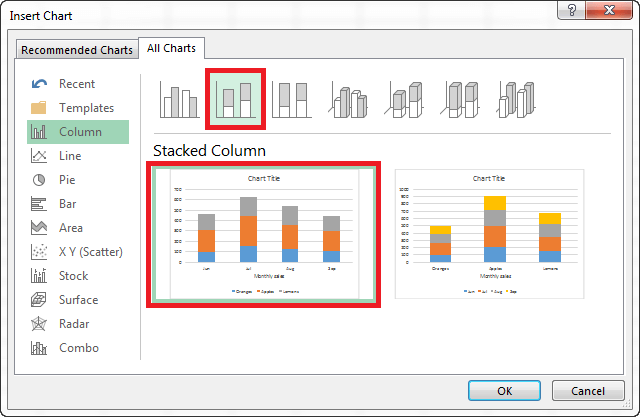
Note: It should be noted that to see all the available chart types immediately, we will be clicking on the Dialog Box Launcher next to Charts as well: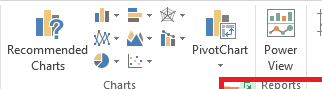
We are done. Now the respective graph is placed on our current worksheet as in the form of embedded chart: 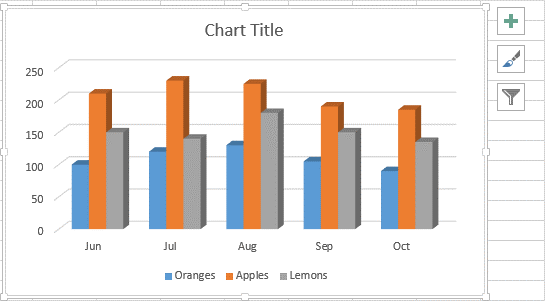
The chart already looks very nice, and we may want to make a few customizations as well as improvements to the above chart. How to create a combo graph in Microsoft Excel to combine two chart types?If in case we want to compare the different data types in our Excel graph, by creating a combo chart is the right way to proceed ahead.
In Microsoft Excel version 2010 and in the earlier versions of Excel, creating a combination chart was a cumbersome task. In Microsoft Excel 2013 - Excel 365, those long-winded guidelines also turn into four quick steps which are as follows: Step 1: First of all, we will select the respective data we want to plot in our chart, and in this example, we will choose the following Fruit Sales table that lists the amounts sold and the average prices. 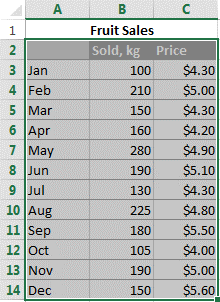
Step 2: Now, on the Insert tab, we will click on the Dialog Box Launcher next to the Charts to open the Insert Chart dialog. Step 3: Now, in the Insert Chart dialog box, we will go to the All Charts tab and select the Combo category. And just at the top of the dialog box, we will see a few predefined combo charts in order to get us started quickly. We can also click on each to see the chart preview, and we will likely find the chart to our liking. 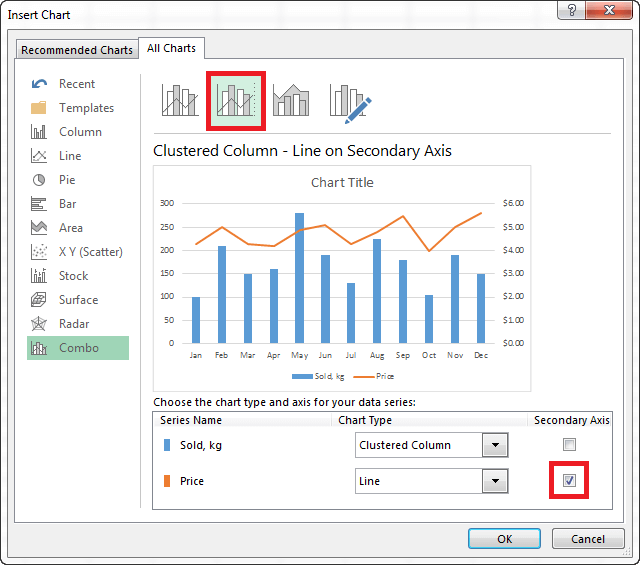
Given that our data series have different scales, and we need a secondary axis in one of them in order to see the values for the both series in the given graph. If none of the predefined combo charts Microsoft Excel displays to us having a secondary axis, then we will select the one we like the most, and check out the Secondary Axis box for one of the data series respectively. And if in case we are not happy with any pre-canned combo graphs, then in that case we just need to select the Custom Combination type and choosing out the desired chart type for each data series. 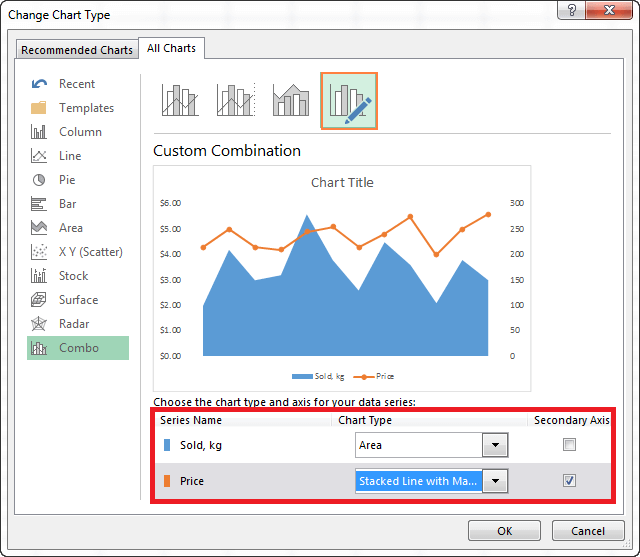
Step 4: Now in this step, we will be clicking on the OK button for the purpose of getting the combo chart inserted into our Excel sheet. After that, we may want to add finishing touches, like typing our chart title and the axis titles. The completed combination chart may look similar to this: 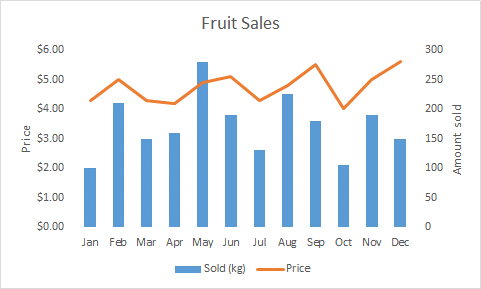
How can one easily customize charts in Microsoft Excel?Making a chart in Microsoft Excel is much easier. But after adding a chart, we may want to modify some of the default elements in order to create an exquisite eye-catching graph. Overall, there are 3 methods that can be used for customizing the charts in Microsoft Excel version 365 - 2013. Step 1: Firstly we will be selecting the chart and look for the needed options on the Chart Tools tabs on the Excel ribbon. 
Step 2: After that, we will be right-clicking on an element present on the chart and selecting out the corresponding context menu item. 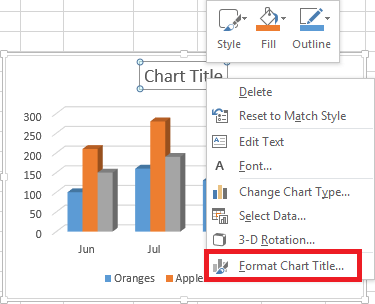
Step 3: Now we will use on-object chart customization buttons, as these buttons primarily gets appear in the top right corner of our chart as soon as we click on them.
Furthermore, for more options, we will be now clicking on the Chart Elements button, and then finding out the element which we want to add or customize in the checklist, and click on the arrow next to it. The Format Chart pane will get appear on the right of our worksheet, where we can select the options which we want according to our requirement: 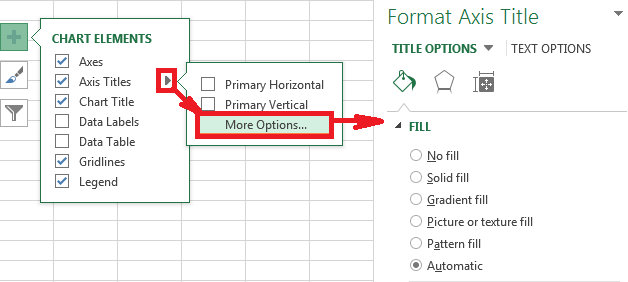
How one can save a graph as an Excel chart template in Microsoft Excel?If we are really happy with the chart which we have just created, then we can save it as a chart template (.crtx file) and then we will apply that Template to the other graphs that we will make in Microsoft Excel. How can one create a chart template in Excel?If in case we want to save a graph as a chart template, then we will be right-clicking on the chart as well as pick out the saves as Templateappears in the pop-up menu: 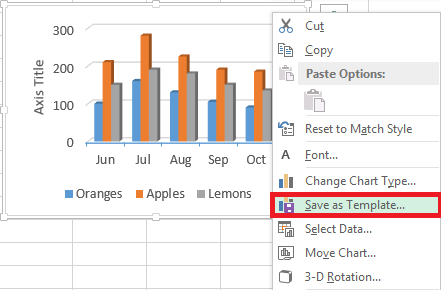
In Microsoft Excel version 2010 and older versions, the Save As Template feature will be residing on the ribbon, on the Design tab > Type group. 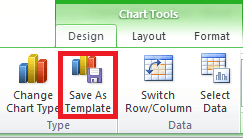
After that, we will be clicking on the Save As Template option, which will bring up the Save Chart Template dialog, where we will type the template name and click on the Savebutton. 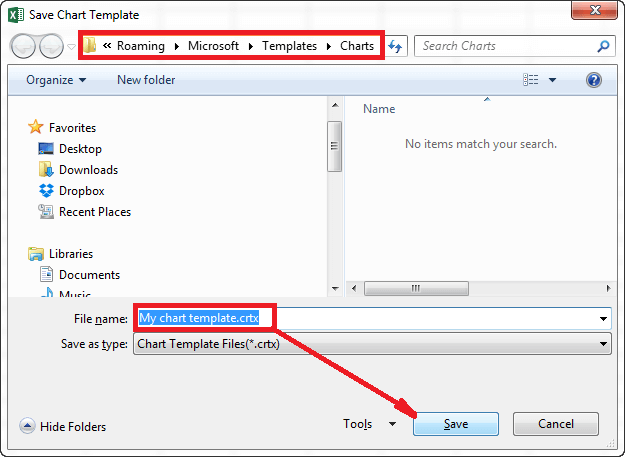
And by default, the newly created chart template will get saved to the special Charts folder. All chart templates stored in this folder are automatically added to the Templatesfolder which will get appears in the Insert Chart and Change Chart Type dialogs when creating a new or modifying an existing graph in Microsoft Excel. We should remember that only the templates saved to the Chartsfolder will appear in the Templates folder in Microsoft Excel. Note: It is recommended to follow mentioned points below while working on saving a graph as a chart template in Microsoft Excel:
How to apply the chart template in Excel? For the purpose of creating a chart in Microsoft Excel that are based on a specific chart template, we will be opening the Insert Chart dialog by just clicking on the Dialog Box Launcher in the Charts group on the ribbon. On the All Charts tab, switch to the Templates folder, and then we will click on the Template which we want to apply. 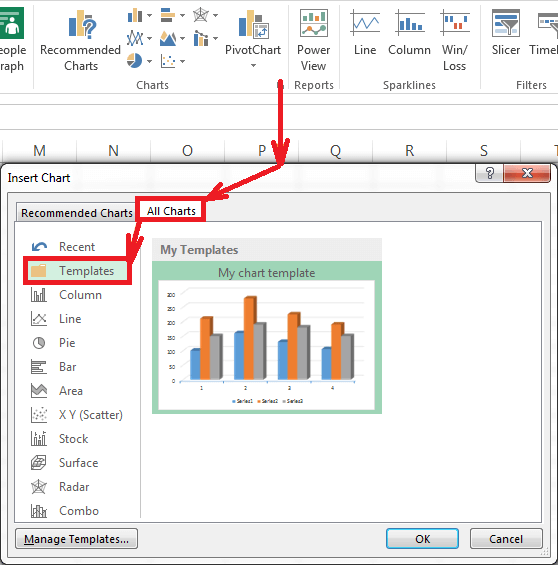
Now in order to apply the chart template to an existing graph, we will go to the Design tab and click on the Change Chart Type in the Type group. 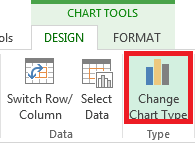
How can one delete a chart template in Microsoft Excel?Now for the purpose of deleting a graph template, we will be opening the Insert Chart dialog, go to the Templatesfolder, and then click on the Manage Templates button present in the bottom left corner. 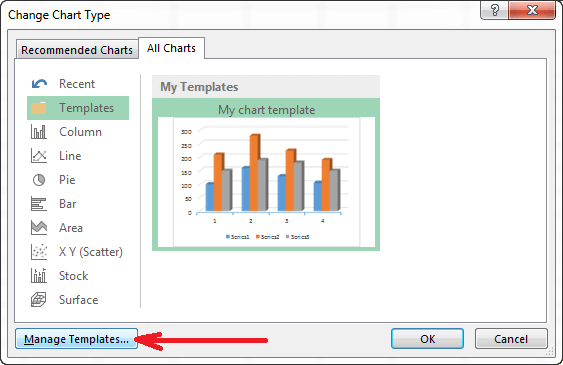
And by clicking on the Manage Templatesbutton, we will open the Chartsfolder with all existing templates. Now we will be right-clicking on the Template which we want to remove and then will choose Delete option in the context menu. How to change the default chart type in an Excel sheet?Microsoft Excel default chart is a real-time-saver, and whenever we need a graph in a hurry or want to have a quick look on certain trends in our respective data, then in that case, we can just make a chart in Excel with a single keystroke, simply selecting out the data to be included in the graph and press one of the following shortcuts: Alt + F1: This shortcut primarily helps us to insert the default chart in the current worksheet. F11: It is used to create the default chart in a new sheet. How to change the default chart type in Excel When we make a graph in Microsoft Excel, the default format is a two-dimensional column chart. And to change out the default graph format, we need to perform the following steps carefully: Step 1: First, we will click on the Dialog Box Launcher next to Charts. Step 2: After that, in the Insert Chart dialog, we will be right-clicking on the chart and then select the Set as Default Chart option in the context menu. 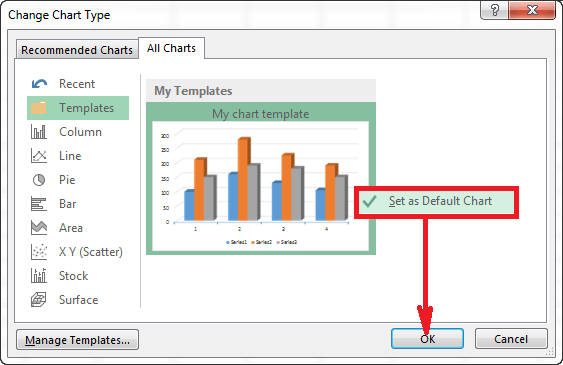
Step 3: After that, click on the OK button in order to save the changes and close the dialog box as well. How can one resize an excel chart in Microsoft Excel?Now for the purpose of resizing the Excel graph, we will click on it and then drag the sizing handles to the size we want. 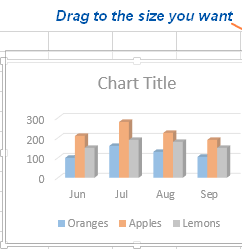
Alternatively, we can enter the desired chart height as well as the width in the Shape Height and Shape Width boxes on the Format tab in the Size group: 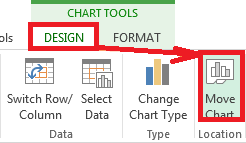
And for more options, we will click on the Dialog Box Launcher next to Size and configure the needed parameters on the pane. 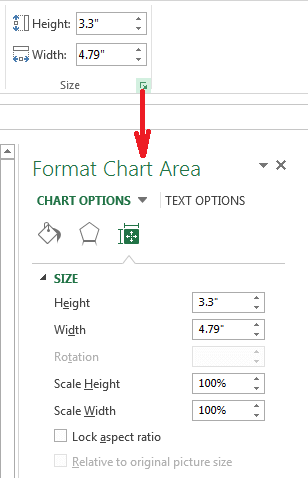
How to move the graph inside and outside of Microsoft Excel?Creating a graph in Microsoft Excel is automatically embedded on the same worksheet as the source data. We can also move the chart to any location on the sheet by dragging it with the mouse. And if we find it easier to work with a graph on a separate sheet, then we can move it there in the following way as follows: Step 1: First, we will select the chart, go to the Designtab on the ribbon and click the Move Chart button. 
Step 2: Now, we will click on the New Sheet in the Move Chart dialog box. If we plan to insert multiple chart sheets in the workbook, give some descriptive names to the new sheet and click the OK button. 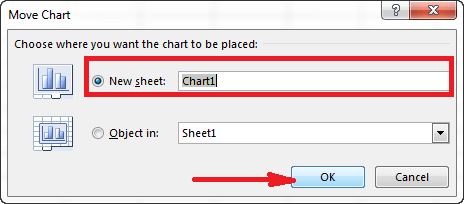
Step 3: If in case we want to move the chart to an existing sheet, then we will be checking out the Object In option, and will select the needed worksheet in the drop-down list.
Next TopicHow to insert Page Numbers in Excel?
|
 Chart Elements button: The chart elements button in the excel sheet is mainly responsible for launching the checklist of all the elements we can modify or add to our graph, as this will only shows those elements which are also applied to the selected chart type. And the Chart Elements button supports Live Preview, so if in case we need clarification on a certain element, hover the mouse on it and see what our graph would look like if we select that option as well.
 Chart Styles button: The chart style button helps us to quickly change the chart styles and colors in the excel sheet.
 Chart Filters button: The chart filter button allows us to show or hide data which are displayed in our chart efficiently.
 For Videos Join Our Youtube Channel: Join Now
Feedback
- Send your Feedback to [email protected]
Help Others, Please Share


