Balance sheet format in Excel
Creating a balance sheet in Excel is a fundamental aspect of financial management for businesses and individuals alike. A balance sheet provides a snapshot of an entity's financial position at a specific point in time, detailing its assets, liabilities, and equity. To construct a balance sheet in Excel, follow these steps:
Title and Introduction:
Begin your Excel balance sheet with a clear title, such as "Balance Sheet as of [Date]." This date represents the specific point in time for which the financial snapshot is taken. In the introduction, briefly explain the purpose of a balance sheet, emphasizing its role in presenting an entity's financial position by detailing its assets, liabilities, and equity.
Excel Setup:
Open a new Excel spreadsheet and label the columns and rows. In the first column, label the rows with "Assets," "Liabilities," and "Equity." This creates the main sections of the balance sheet. Arrange the assets above liabilities and equity to maintain a standard format.
- Asset Section:
Under the "Assets" heading, create two sub-sections: "Current Assets" and "Non-Current Assets." List current assets like cash, accounts receivable, and inventory. Below this, list non-current assets such as property, equipment, and investments. Each asset category should have a corresponding monetary value in the adjacent column.
- Liability Section:
Below the "Liabilities" heading, create sub-sections for "Current Liabilities" and "Non-Current Liabilities." List current liabilities like accounts payable and short-term debt, and non-current liabilities such as long-term loans and bonds. Enter the corresponding amounts in the adjacent column.
- Equity Section:
Under the "Equity" heading, label the first cell as "Owner's Equity" or "Net Worth." Include components like common stock, retained earnings, and additional equity items if applicable. Enter the respective values in the adjacent column.
- Formatting Cells:
Format cells for currency values to enhance readability. Select the cells and choose the currency format from the formatting options. Ensure consistency in formatting throughout the spreadsheet for a professional and organized appearance.
- Calculating Totals:
Add formulas to calculate totals for each section. For example, sum the current assets and long-term assets to get the total assets. Repeat this process for liabilities and equity. Include a formula at the bottom to ensure the balance sheet adheres to the accounting equation: Assets = Liabilities + Equity.
- Accuracy Check:
Double-check all entries and calculations for accuracy. Ensure that the total assets equal the sum of liabilities and equity. An imbalance could indicate an error in data entry or calculation.
- Additional Information:
Consider adding notes or additional details to provide clarity on specific items, especially if the balance sheet is intended for external stakeholders. Include any relevant footnotes or explanations to help users understand the figures presented.
- Regular Updates:
The balance sheet is a dynamic document that should be updated regularly to reflect the most recent financial information. Set a schedule for updating the sheet, such as monthly, quarterly, or annually, depending on your reporting requirements.
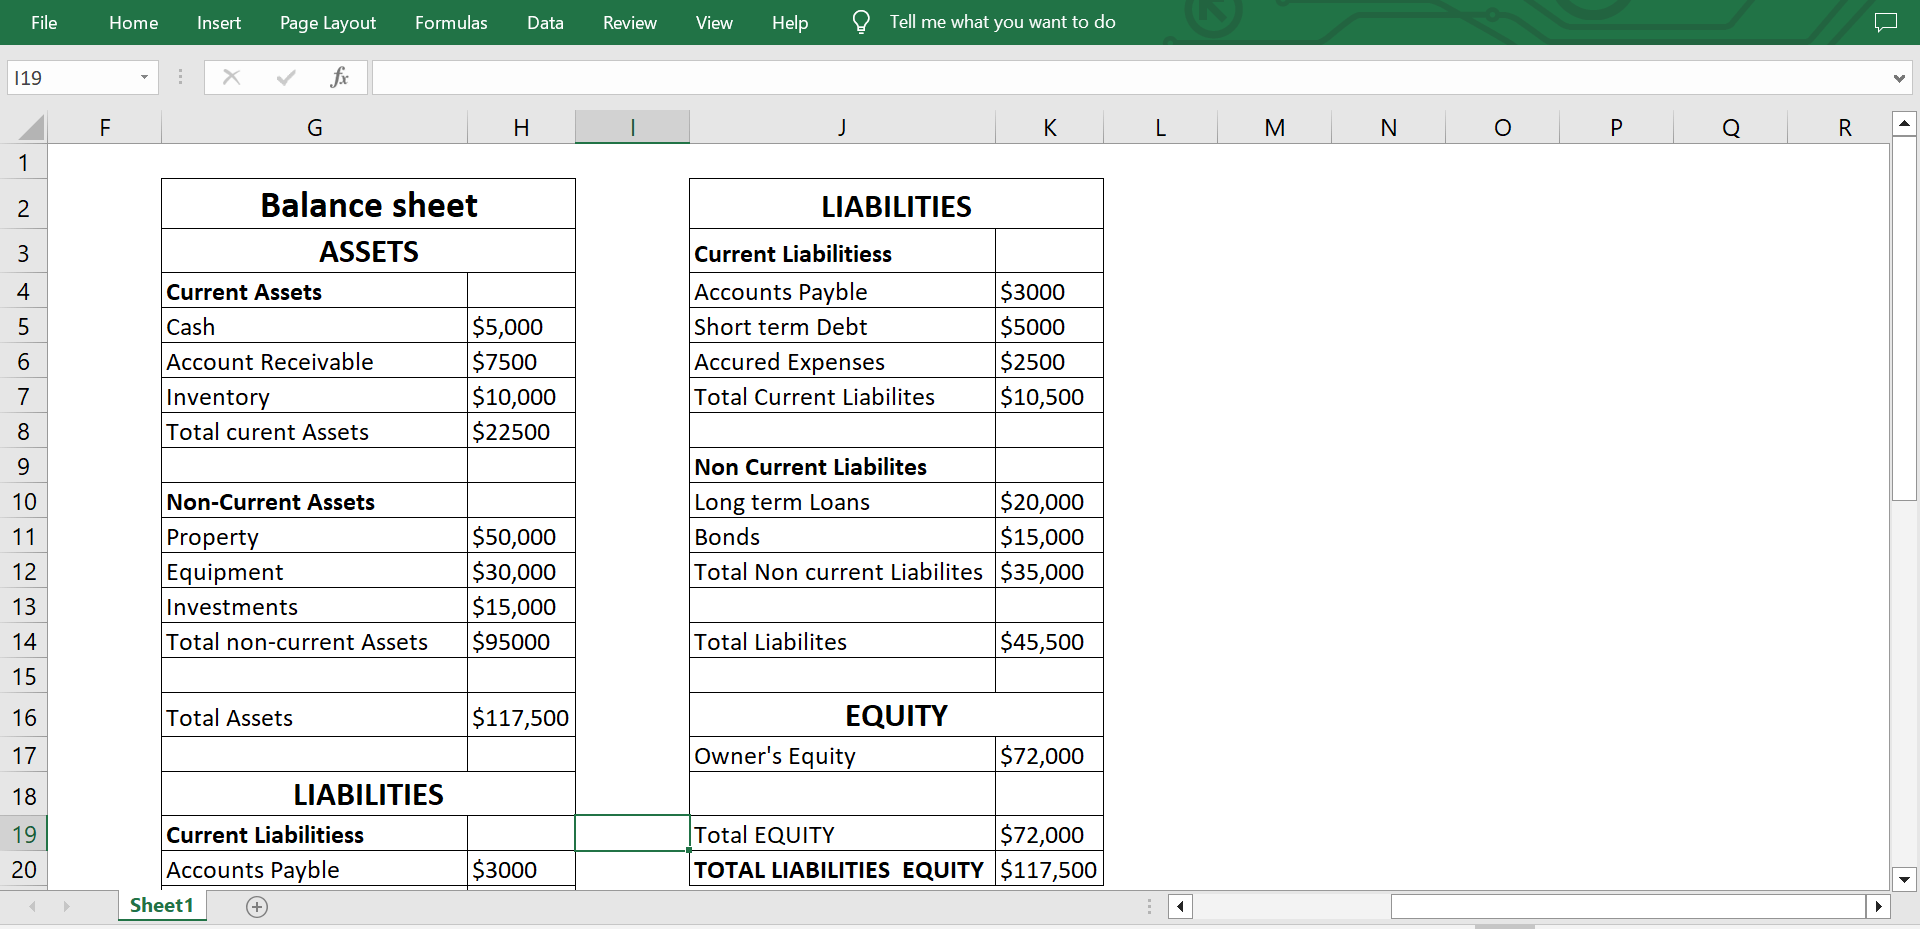
BALANCE SHEET
The balance sheet is a financial statement that provides a snapshot of a company's financial position at a specific point in time.
ASSETS
Assets represent what a company owns and can be categorized into two main types: current assets and non-current assets.
Current Assets:
Cash: $5,000 - The amount of cash the company currently holds.
Accounts Receivable: $7,500 - The money owed to the company by its customers.
Inventory: $10,000 - The value of goods and materials held for production or sale.
Total Current Assets: $22,500 - The sum of the current assets.
Non-Current Assets:
Property: $50,000 - The value of owned real estate.
Equipment: $30,000 - The value of machinery and tools used in the business.
Investments: $15,000 - The value of long-term investments.
Total Non-Current Assets: $95,000 - The sum of the non-current assets.
TOTAL ASSETS: $117,500 - The sum of both current and non-current assets, representing the total resources owned by the company.
LIABILITIES
Liabilities represent what a company owes and are also categorized into current and non-current liabilities.
Current Liabilities:
Accounts Payable: $3,000 - The amount owed by the company to its suppliers.
Short-Term Debt: $5,000 - The amount of debt due in the short term.
Accrued Expenses: $2,500 - The amount of expenses that have been incurred but not yet paid.
Total Current Liabilities: $10,500 - The sum of the current liabilities.
Non-Current Liabilities:
Long-Term Loans: $20,000 - The amount of loans with a maturity longer than one year.
Bonds: $15,000 - The value of bonds issued by the company.
Total Non-Current Liabilities: $35,000 - The sum of the non-current liabilities.
TOTAL LIABILITIES: $45,500 - The sum of both current and non-current liabilities, representing the total obligations of the company.
EQUITY
Equity represents the ownership interest in the company, including common stock, retained earnings, and additional equity components.
Owner's Equity: $72,000 - The residual interest of the owner in the assets of the company.
TOTAL EQUITY: $72,000 - The sum of all equity components.
TOTAL LIABILITIES & EQUITY: $117,500 - The sum of total liabilities and total equity, confirming the fundamental accounting equation: Assets = Liabilities + Equity.
Examples:
Advantages of Balance Sheets:
- Financial Health Snapshot: Provides a quick overview of an entity's financial health at a specific point in time.
- Investor Confidence: Builds transparency, enhancing investor confidence in a company's financial position.
- Lending Decisions: Assists creditors and lenders in evaluating creditworthiness and assessing risk.
- Financial Analysis: Facilitates the calculation of key financial ratios for liquidity, solvency, and efficiency.
- Strategic Decision-Making: Aids management in making informed decisions about capital, investments, and overall financial strategy.
- Risk Management: Helps in identifying and managing financial risks associated with the company's structure.
- Mergers and Acquisitions: Essential for due diligence, enabling potential acquirers to assess the target company's financial health.
- Regulatory Compliance: Meets regulatory requirements, ensuring adherence to accounting and financial reporting standards.
- Benchmarking: Allows companies to compare their performance against industry standards and peers.
- Internal Reporting: Internally used for tracking financial changes and supporting day-to-day decision-making.
- Tax Planning: Provides information relevant to tax planning, including depreciation on assets and potential taxable income.
Disadvantages of Balance Sheets:
- Historical Snapshot: Offers a static view at a specific moment, potentially missing ongoing changes or trends.
- Valuation Challenges: Valuation of certain assets, such as intangibles, may be subjective and pose challenges.
- Dependence on Accounting Policies: Influenced by accounting policies, leading to variations that affect comparability.
- Limited Information on Market Value: Does not reflect market values for assets like property, which may have changed since acquisition.
- Complexity for Non-Financial Stakeholders: Non-financial stakeholders may find the terminology and structure complex.
- Not Necessarily Indicative of Future Performance: Does not predict future financial performance.
- Omission of Non-Financial Assets: May not include valuable non-financial assets like human capital or brand value.
- Dependence on Accurate Data: Reliability depends on the accuracy of entered data, with errors leading to misinterpretation.
- Limited Disclosure of Liabilities: Some obligations may not be explicitly stated, leading to incomplete information.
- Not Always Reflective of Economic Reality: Historical cost may not accurately reflect the current economic value of assets.
Applications:
The applications of a balance sheet extend across various sectors and play a crucial role in financial management for businesses, nonprofits, and individuals. Here are some key applications:
- Financial Analysis:
Liquidity Assessment: The balance sheet helps evaluate the company's ability to meet short-term obligations by analyzing current assets and liabilities.
Solvency Evaluation: It provides insights into the long-term financial health of the entity by assessing the proportion of long-term liabilities to equity.
- Investor Decision-Making:
Investors use balance sheets to assess the financial stability of a company before making investment decisions. They look at the company's assets, liabilities, and equity to gauge its overall financial health.
- Creditors and Lenders:
Creditors and lenders use balance sheets to evaluate the creditworthiness of a company. They assess the ratio of debt to equity and the ability of the company to service its debt.
- Strategic Planning:
Business leaders and management use balance sheets for strategic planning. It helps in making decisions related to capital structure, financing options, and investment in assets.
- Mergers and Acquisitions:
During mergers and acquisitions, potential acquirers analyze the target company's balance sheet to understand its financial position, potential risks, and the overall health of its operations.
- Risk Management:
Balance sheets assist in identifying and managing financial risks. By examining the composition of assets and liabilities, companies can make informed decisions to mitigate risks associated with their financial structure.
- Government and Regulatory Compliance:
Regulatory authorities often require companies to maintain and disclose their balance sheets. Compliance with financial reporting standards ensures transparency and accountability.
- Internal Reporting:
Companies use internal balance sheets for day-to-day financial management. It aids in tracking changes in assets, liabilities, and equity over time, facilitating better decision-making.
- Benchmarking:
Companies can compare their balance sheets with industry benchmarks to assess their financial performance relative to competitors. This helps in identifying areas for improvement or areas of strength.
- Tax Planning:
Balance sheets contribute to tax planning by providing information on assets and liabilities that may impact taxable income. For example, depreciation on assets can affect taxable income.
- Personal Finance:
Individuals use personal balance sheets to assess their financial standing. It includes assets like savings, investments, and real estate, as well as liabilities such as mortgages and loans.
- Nonprofit Organizations:
Nonprofits use balance sheets to demonstrate their financial health to donors and grantors. It provides a snapshot of assets and liabilities, showcasing the organization's ability to fulfill its mission.
|

 For Videos Join Our Youtube Channel: Join Now


