| |

Excel VAR.S() FunctionThe VAR.S() function (also commonly known as the VARS function) is a statistical function in Excel. The main purpose of this function is to help the user to calculate the variance of a given sample data set. Now, let's have a look at the detailed definition of this function. The VAR.S() function gives the variance of the given set of values or range of values. It is basically the sum of squares of deviation of a value from its mean divided by the number of values. It is the square of standard deviation and just like for standard deviation, the lower the variance, the better, as it implies that the data is not that different. Blank cells, text, and error values are ignored. Although the VAR.S will ignore the text and logical values that will be passed into as cell references, it will evaluate logical values and numbers values passed directly as arguments. In simple terms, we can say that this function will ignore TRUE when it arrives in a range like B2:B11 but will consider the TRUE when it is passed as an argument. The VAR.S() function was not introduced until the Excel 2010 version. Before this, the Excel users used the VAR function. The VAR.S function is an upgraded version of the VAR function; therefore, there is not much of a difference. If you want to calculate the variance of an entire population, then go for the Excel VAR.P function (also commonly known as VARP). Both the functions work the same way. NOTE: The VAR.S() function ignores the blank, text, error and non-numeric values, including the Boolean values.Syntax
=VAR.S([number1],[number2] and so on..)
Parameter
NOTE: You can provide up to 254 number arguments or arrays of values to the VAR.S function.IMPORTANT POINTS facts to know about VAR.S
ExamplesExample 1: Calculate variance for the following set of numbers.
Follow the below steps to calculate the variance of the above set of numbers: Step 1: Open the Excel worksheet and paste the above data. Step 2: Insert another row with the name VAR. Step 3: Apply the VAR.S formula and, in the numbers argument, pass the range of numbers. Simply select the cells in the column, and Excel will calculate the variance for you. Step 4: Drag the formula to the subsequent columns, and you will have the following output. 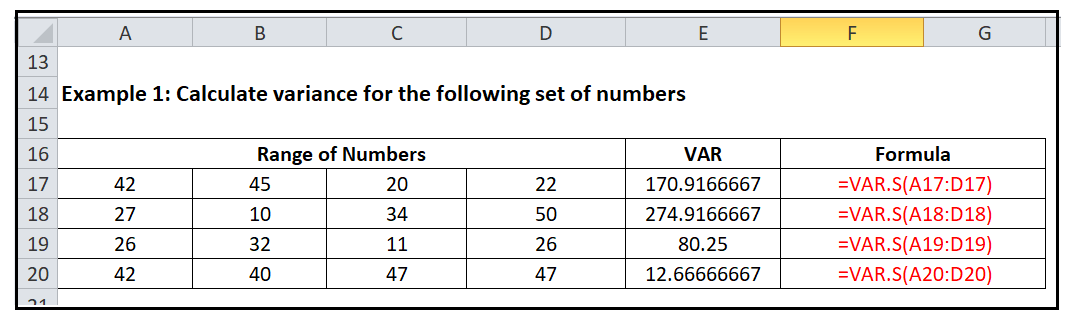
NOTE: Use the STDEV.S function to calculate standard deviation of these numbers and then use SQRT function to calculate square root of the variance - results will be sameExample 2: Calculate variance for the following set of numbers
Follow the below steps to calculate the variance of the above set of numbers: Step 1: Open the Excel worksheet and paste the above data. Step 2: Insert another row with the name VAR. Step 3: Apply the VAR.S formula and, in the numbers argument, pass the range of numbers. Simply select the cells in the column, and Excel will calculate the variance for you. Step 4: Drag the formula to the subsequent columns, and you will have the following output. 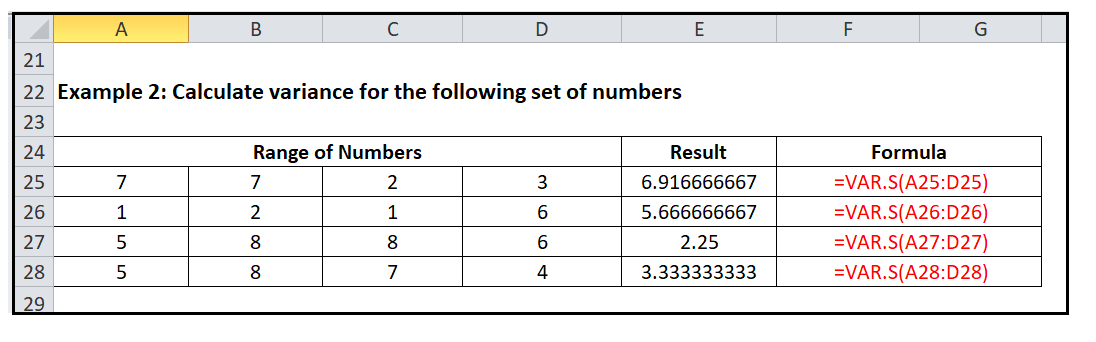
Var.S Function ErrorsIf the Excel Var.S Function return any error, it will be likely because of any one of the following reasons:
Difference in VAR.P & VAR.S function
NOTE: The VAR() and VAR.S() function return the exact same output, so we can use either function to calculate the sample variance for a given dataset.
Next TopicEmail Workbook
| ||||||||||||||||||||||||||||||||||||||||||||||||||||
 For Videos Join Our Youtube Channel: Join Now
Feedback
- Send your Feedback to [email protected]
Help Others, Please Share


