| |

How to use Linest Function in Excel?What is called Linest Function in Excel?The LINEST function in Excel is used to calculate a straight line that best fits a set of data points by calculating the slope and y-intercept of the line using the least squares method. The LINEST function takes a set of x-values and a set of y-values as input and returns an array of coefficients, including the slope, y-intercept, and standard error values for these coefficients. The syntax for the LINEST function is: =LINEST(known_y's, [known_x's], [const], [stats]) where, known_y's is the range of cells containing the y-values for the data points known_x's is an optional range of cells containing the x-values for the data points const is an optional logical value that determines whether to force the y-intercept to be zero (TRUE) or not (FALSE) stats is an optional logical value that determines whether to include additional statistical information in the output array The output array contains the following coefficients: The slope of the line (m) The y-intercept of line (b) The coefficient of determination (r^2) The standard error of the slope The standard error of the y-intercept You can use these coefficients to create an equation for the line and analyze the line's goodness of fit to the data. The LINEST function is commonly used in linear regression analysis and creating trendlines in Excel charts. Uses of Linest function in ExcelThe LINEST function in Excel is a powerful tool for conducting linear regression analysis and can be used for a variety of purposes, including: Trendline creation: LINEST can be used to create trendlines for charted data. It can calculate the slope and intercept of a linear trendline and return the coefficients needed to plot the line. Data analysis: LINEST can be used to analyze data to determine how closely a set of data points fit a linear model. The coefficient of determination (r-squared) can be used to assess the model's goodness of fit. Prediction: The LINEST function can predict future values based on a linear trend. Using the LINEST function coefficients, you can create an equation to predict future values based on known data. Statistical analysis: LINEST can perform statistical analysis on data sets, including calculating the slope and intercept standard error and confidence intervals for the slope and intercept. Experimental design: The LINEST function can determine the relationship between two variables. It can be used to determine one variable's effect on another and calculate the slope and intercept of a linear regression line. Overall, the LINEST function is a useful tool for analyzing and interpreting data and can be used in various applications where linear regrRegressionnecessary. How to use Linest Function in Excel?To use the LINEST function in Excel, follow these steps: Step 1: Organize your data into two columns, one for the x-values, namely B1:B13 (independent variable), and one for the y-values (dependent variable), namely C1:C13. The data should be in contiguous cells with no blank cells. Step 2: In a blank cell, namely E3and F3, type the formula "=LINEST(y-values, x-values)," replacing "y-values" with the range of cells containing the dependent variable and "x-values" with the range of cells containing the independent variable. Hence the formula is modified as =LINEST (C1:C13, B1:B13) Step 3: Press Ctrl+Shift+Enter to enter the formula as an array formula. This will cause Excel to display the slope coefficient and intercept constant in cell F3. 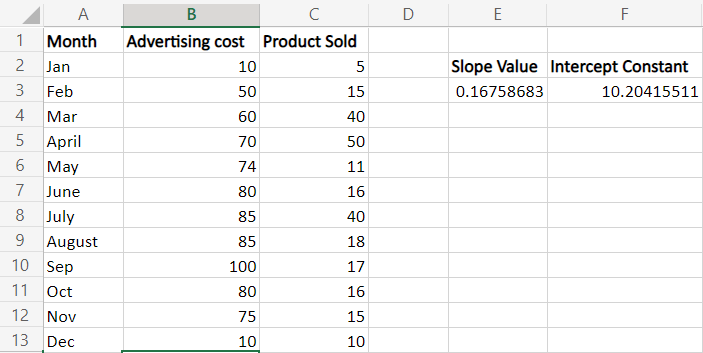
In this example, the slope value is approximately displayed as 0.16(rounded two decimal points), which indicates that when x increases by 1, y increases by 0.16 The Y-intercept value is 10.20415511. When x=0, the expected value of y is =10.2041. While plotting the graph, this is the value at which the regression line crosses the y-axis. The two values are used to create a formula as follows, Y=0.167*x-10.204 For example, if the user spends ten on advertising, the expected amount of product that may sell is as follows, Y=0.167*10-10.204 In this example, the slope and intercept value can be obtained by using the formula, Slope formula, =SLOPE (C2:C13, B2:B13) =INDEX (LINEST (C2:C13, B2:B13), 1) Intercept Formula, =INTERCEPT (C2:C13, B2:B13) =INDEX (LINEST (C2:C13, B2:B13), 2) 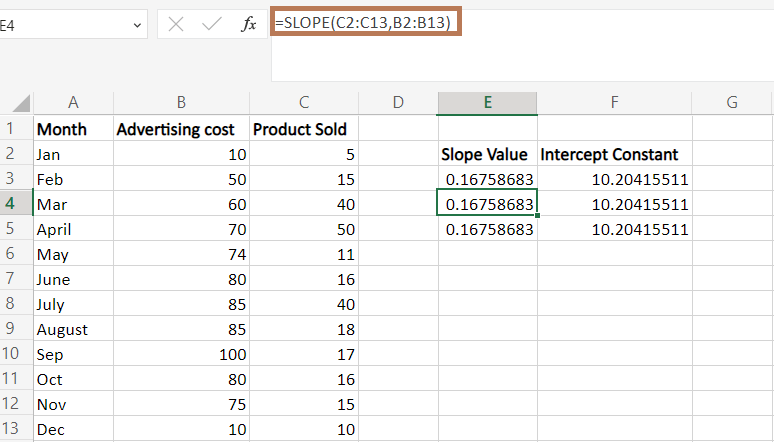
In the worksheet, all three formula displays the same result What is called Linear Regression?Linear regression statistical analysis technique allows you to examine the relationship between two variables, a dependent and independent variable. It is useful for predicting the value of a dependent variable based on the value of an independent variable. Linear Regression is sub-divided into the following types,
Simple Linear RegressionThis is used to model the relationship between one dependent and independent variable. In simple linear regrRegressionline is fitted to the data that best describes the relationship between the two variables. Here is an example: the dependent variable is calculated based on the independent variable(x). The steps to be followed are, Step 1: Prepare your data: Create a table that includes the independent variable in one column, B1:B13, and the dependent variable in another column, namely C1:C13. 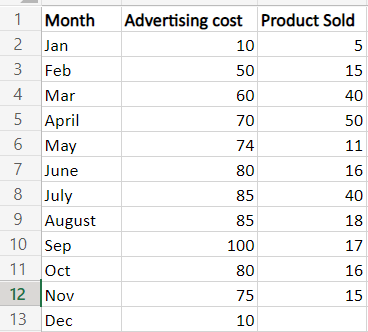
Step 2: Here in the worksheet to find the number of products sold for December, the formula used is =SUM (LINEST (C2:C12, B2:B12)*{10, 1}) Step 3: Select a new cell, E5, and enter the formula. Press Enter and the y value for the x value will be displayed. The result will be the number of products sold for the advertising cost of 10. 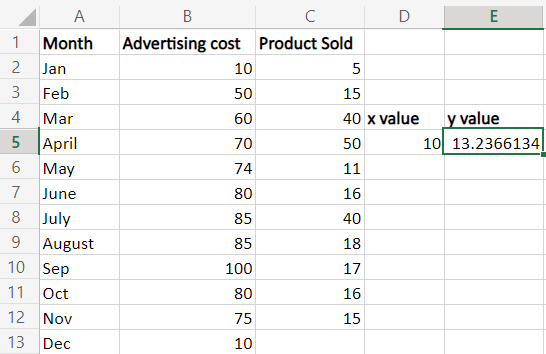
Here in the worksheet, the total sale of the product for December is 13. 2366134. One can use the cell reference instead of directly entering the value in the formula. The formula can be modified as, =SUM (LINEST (C2:C12, B2:B12)*(E2:F2)). The constant value one is entered in cell F2 to apply this formula. The intercept and slope for the same data are calculated to verify the result, and to calculate y; linear regression formula is used. 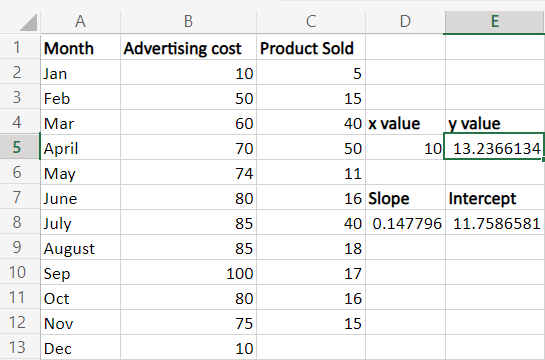
The linear regression formula used is, =D8*D5+E8, which is the value of y. In the formula, D8 is the slope, D5 is the x value, and E8 is the intercept. Multiple Linear RegressionMultiple linear regressions are a statistical analysis technique that allows you to examine the relationship between two or more independent variables and a dependent variable. It is useful for predicting the value of a dependent variable based on the values of two or more independent variables. An example of Multiple RegrRegressionas follows, Step 1: Prepare your data: Create a table that includes the independent variables in separate columns and the dependent variable in a separate column 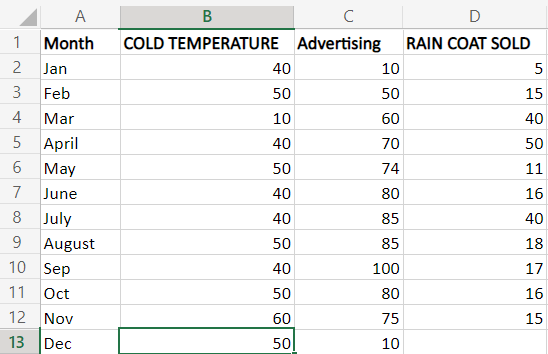
Step 2: To calculate the amount of raincoats sold for advertising cost 10, the formula to be used is, =SUM (LINEST (D2:D10, B2:C10)*{10, 100, 1}). The formula B2:C10 are two sets of independent values(x), and D2:D10 are dependent variables(y). To calculate the sales, the respective coefficients must multiply with the x values put in an array format in the formula {10, 100, 1}. The formula '1' denotes the last value, the intercept value, which is multiplied by the x values. The multiple regrRegressionurns the slope coefficient from right to left, where the advertising cost is returned first, and temperature is returned as a second coefficient. 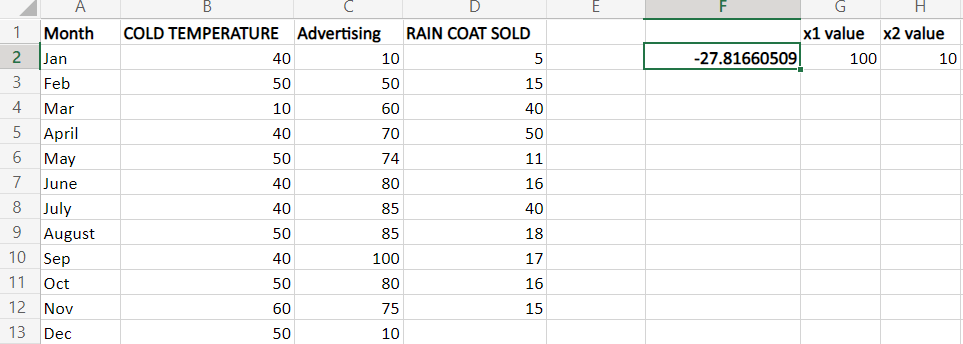
Instead of entering the values directly in the cell, the cell reference is used. The formula is modified as, =SUM (LINEST (D2:D10, B2:C10)*(G2:I2) 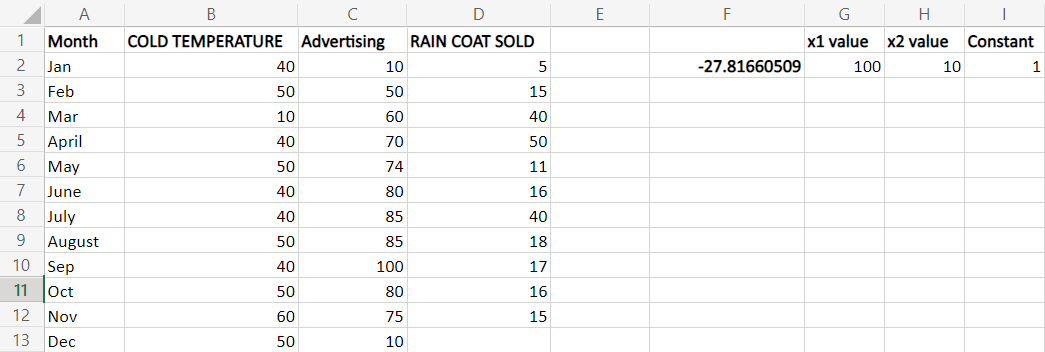
The constant value is entered in cell I2. Therefore the cell reference is added to the formula. Using True and False in Regression StatisticsStep 1: Enter the data in the worksheet, namely A1:D10 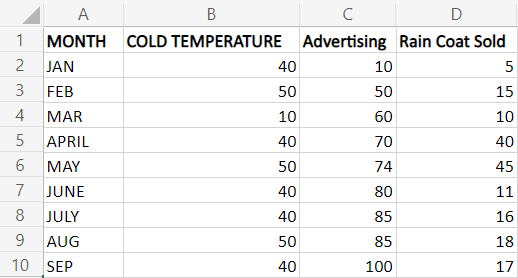
Step 2: Select a range of three rows and five columns as the data contains two independent values and one intercept value and enter the formula as =LINEST (D2:D10, B2:C10, TRUE, TRUE) Step 3: Press Enter. The result will be displayed in the cell. 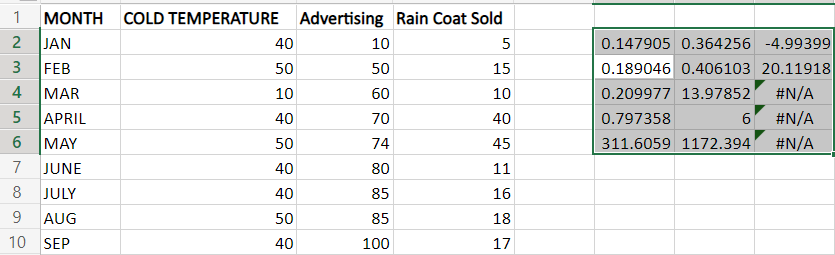
To rectify the error message #N/A, the formula is modified as, =IFERROR (LINEST (D2:D10, B2:C10, TRUE, TRUE),"") 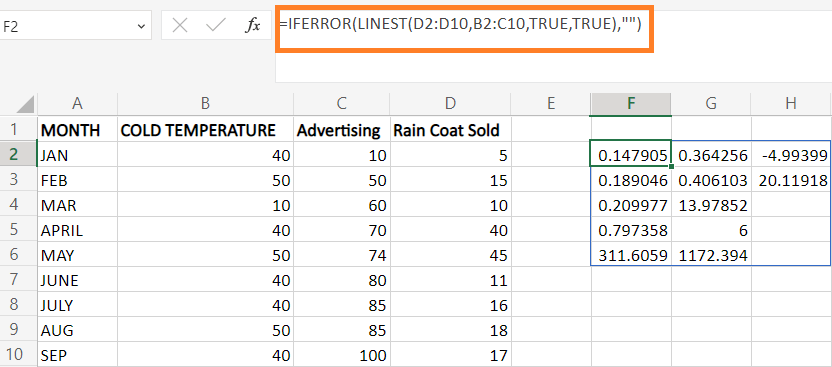
The explanation for each value is demonstrated in the screenshot. 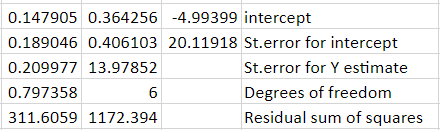
From the above tabular column, the various regression statistics are explained here as follows, Standard Error-The standard error is a statistical measure of the accuracy of the regression model. Specifically, it is the standard deviation of the residuals, which are the differences between the observed values of the dependent variable and the predicted values based on the regression equation. The standard error is calculated by dividing the square root of the residual sum of squares (RSS) by the degrees of freedom (df). The RSS is the sum of the squared differences between the predicted values and the actual values of the dependent variable. The df is the number of observations minus the number of independent variables in the regression model. F statistic: the F statistic is a statistical measure used to test the overall significance of the regression model. Specifically, it measures the ratio of the explained variance to the unexplained variance in the dependent variable. The F statistic is calculated by dividing the explained variance (SSR, or sum of squares due to regrRegression the degrees of freedom of the regrRegression1, where k is the number of independent variables) and dividing that by the unexplained variance (SSE, or sum of squares due to error) divided by the degrees of freedom of the error (n-k), where n is the number of observations. Degrees of Freedom (df) - The degrees of freedom (df) refer to the number of independent observations available to estimate the parameters of the regression model. It is used to calculate the standard error, t-statistic, and F-statistic, which are all measures of the accuracy of the regression model. The degrees of freedom for the regrRegression_regression) are equal to the number of independent variables in the model minus one (k-1). This is because one degree of freedom is lost when estimating the slope of the regression line, leaving k-1 degrees of freedom to estimate the intercept and other parameters. Regression Sum of Squares: In the context of the LINEST function in Excel, the regression sum of squares (SSR) measures the amount of variability in the dependent variable that the regression model explains. It is also known as the explained sum of squares and is used in the calculation of the F-statistic. In Excel's context of the LINEST function, the residual sum of squares (SSE) measures the variability in the dependent variable that the regression model does not explain. It is also known as the sum of squared residuals and is used to calculate the standard error and t-statistic. SummaryThe LINEST function in Excel is a powerful tool for performing linear regression analysis on a data set. By providing a range of statistical outputs, the function enables users to assess the regression model's quality and the estimated parameters' significance. The slope and intercept of the best-fit line provide estimates of the relationship between the dependent and independent variables. At the same time, the R-squared value measures the goodness of fit of the regression model. The standard error estimates the variability of the error term in the regression model, while the F-statistic tests the significance of the regression model as a whole. The degrees of freedom and regression sum of squares provide additional information about the fit of the model and the amount of variability in the dependent variable that is explained by the regrRegression erall, the LINEST function in Excel is a powerful tool for analyzing linear relationships in data and can provide valuable insights into the relationship between variables. However, it is important to interpret the function's results carefully and consider the limitations of linear regression analysis in modeling complex relationships. |
 For Videos Join Our Youtube Channel: Join Now
Feedback
- Send your Feedback to [email protected]
Help Others, Please Share


