| |

Random Samples in ExcelWhat is called Random Sample?A random sample in Excel is a subset of data that is selected randomly from a larger population. It is a way to create a smaller data set representative of the larger population. A random sample is often used in statistical analysis to make inferences about the population based on the characteristics of the sample. Excel has built-in functions that can be used to create a random sample, such as the RAND function and the RANK function. These functions can be combined with the INDEX function to select a random sample from a data set. Syntax: =INDEX(data,RANK.AVG(RAND(),RANDARRAY(rows,1,0,1)),1) It is used to create a random sample of "rows," a number of a row from the "data" range. Using a random sample in Excel can help reduce the risk of bias in data analysis and increase the accuracy of results. It can also help save time and effort in data analysis by reducing the amount of data that needs to be processed. Why select a random sample in Excel?Selecting a random sample in Excel can be useful for several reasons. Here are some of the main reasons why you might want to select a random sample in Excel: Efficiency: When working with a large data set, it can be time-consuming and resource-intensive to analyze all of the data. Selecting a random sample can reduce the amount of data you need to analyze, making the process more efficient. Cost-effectiveness: Collecting data can be expensive; in some cases, collecting data for an entire population may be challenging. Selecting a random sample can provide a cost-effective way to collect data while maintaining a high accuracy level. Accuracy: A random sample can be more representative of the population than a non-random sample. By selecting a random sample, you can reduce the risk of bias in your analysis and increase the accuracy of your results. Inference: A random sample can make inferences about a larger population. By analyzing the characteristics of the random sample, you can conclude the population as a whole. Testing: If you are testing a new process or method, selecting a random sample can be a useful way to evaluate the effectiveness of the process or method before implementing it on a larger scale. Overall, selecting a random sample in Excel can be a useful way to reduce the amount of data you need to analyze while maintaining a high accuracy level in your results. It can also be a cost-effective and efficient way to collect data and draw conclusions about a larger population. Merits of Using Random SamplesThe merits of using Random Samples are as follows, 1. Representative of the population: Random sampling ensures that each member has an equal chance of being selected, which helps make the sample more representative of the population. This means that the sample is more likely to reflect the population's characteristics accurately. 2. Reduction of bias: Random sampling helps to reduce bias in the sample selection process. By eliminating the possibility of non-random factors influencing the sample selection, the results are more likely to be unbiased and more accurate. 3. Efficiency: Random sampling can be a more efficient way of obtaining a sample than other methods, as it can help to reduce the time and cost involved in selecting a sample. 4. Simplifies analysis: Random sampling simplifies the analysis process, as the sample is more likely to be representative of the population, allowing for more reliable inferences and conclusions to be drawn from the data. 5. Generalizability: Using random samples can increase the generalizability of the results to the entire population, making it possible to draw inferences and make predictions about the population based on the sample data. Overall, using random samples can help increase the accuracy, efficiency, and generalizability of research results, making it a valuable tool for data collection in various fields. What is called RAND () function?RAND () is a built-in Excel and spreadsheet software function that generates a random number between 0 and 1. When the RAND () function is used in a formula, it will return a new random number each time the worksheet is calculated. The syntax for the RAND () function is very simple, and it does not take any arguments or parameters. To use the function, simply type "=RAND ()" into a cell, and press Enter. Excel will generate a random number between 0 and 1 and display it in the cell. The RAND () function is often used with other Excel functions to simulate data, create random samples, or generate random numbers for statistical analysis. For example, you could use the RAND () function to randomly assign treatments to participants in a study or randomly select a sample of participants for analysis. How to select a random sample in Excel?To select the random sample in Excel, the steps to be followed are as follows, Example 1: Select the random data from the list of given data. Step 1: Enter the data in the required worksheet namely A1:A11 Step 2: There are eleven names present in the worksheet. To display any random name from the list, select a new cell, namely B2, and enter the formula as =INDEX ($A$1:$A$11, RANDBETWEEN (1, COUNTA ($A$1:$A$11)), 1). Step 3: Press Enter. The random name will be displayed in cell B2. 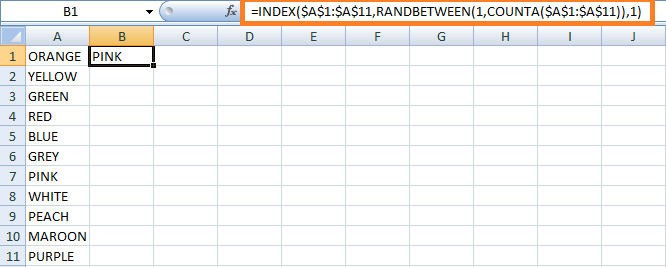
In the worksheet, the Random name is displayed as "PINK." The alternative formula to find the random variable is as follows, =INDEX ($A$1:$A$11, RANDBETWEEN (1, ROWS ($A$1:$A$11)), 1). 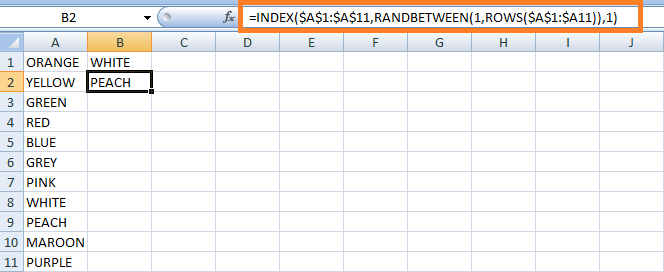
Note: The RANDBETWEEN function is volatile, meaning that it will recalculate every time the worksheet is recalculated, regardless of whether any of the function's arguments have changed. This can cause performance issues with larger workbooks or complex formulas.Working Process of the FormulaIn the formula, the INDEX function is nested inside to extract the value from the list based on a random row number generated by the RANDBETWEEN function. The RANDBETWEEN function takes two arguments: The bottom and top values define the range of random integers you want to generate. For example,=RANDBETWEEN(1,100) would generate a random integer between 1 and 100(inclusive). Excel's random number generator selects a random value between 0 and 1. This value is always a decimal number. This number indicates the row_num argument of the INDEX function telling which row to pick. Based on the column number the value is extracted from the specified column where the column_num argument returns the value. What is called Duplicate values in Random values?In the context of generating random values using functions like RANDBETWEEN or RAND, a duplicate refers to a situation where the same random value is generated more than once in a set of generated random values. For example, if you generate ten random integers between 1 and 10 using the RANDBETWEEN function, and two or more of the numbers generated are the same (e.g., 3, 5, 6, 7, 2, 8, 6, 1, 4, 10), then you have generated duplicates. The likelihood of generating duplicates increases as the number of random values generated approaches the total number of possible values in the range. For example, if you generate 100 random integers between 1 and 100, there is a higher chance of generating duplicates than if you generate only ten random integers between 1 and 100. It is important to remember that duplicates may or may not be desirable depending on the context in which the random values are used. For example, in some simulations, duplicates may be acceptable or even necessary, while in others, duplicates may need to be avoided to ensure accurate results. How to generate random values without duplicates?The methods to generate the random values without duplicates are as follows, Step 1: Enter the names in the list A1:A10 Step 2: Enter the formula in the cell B1 and enter the formula as =RAND () Step 3: There displays a random value in cell B1 and drag the formula towards cell B10. The value will be displayed for the remaining cells. 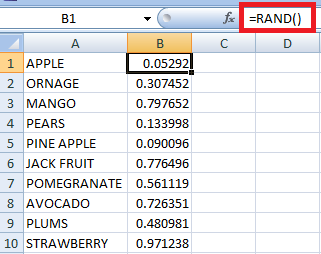
Step 4: To select a random value, enter the formula in the cell C1 as =INDEX ($A$1:$A$10, RANK (B1, $B$1:$B$10), 1) Step 5: Press Enter. The random value will be generated in cell C1. Step 6: Copy and paste the formula in the count of another cell as the required number of random values you want. Here five random values are generated from the cell range C1:C5. 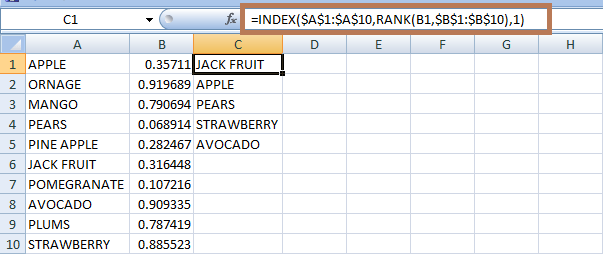
Working process of the formulaThe RAND function generates the random numbers in column B. The RANK function generates the rank of the random number in the same row. For example, RANK (B1, $B$1:$B$10) in cell C1 gets the rank of the number in B1. If the formula is copied to C2, the relative reference B1 changes to B2 and returns the rank of the number in B2, and this similar method is followed for the remaining data. The RANK function returns the number where it is fed to the row_num argument of the INDEX function, where the value is retrieved from the specified row. In this example, the column number is mentioned as 1, as it retrieves the value from the first column. How to select random rows in Excel?Sometimes the spreadsheet contains more than one column of data. To select the required row of samples, a random number should be created for all the rows. These random numbers should be sorted, and the required rows should be selected. The steps to be followed are, Step 1: Enter the data in the worksheet, namely A1:C11. 
Step 2: After creating the data, choose a new cell namely D2, and enter the formula as =RAND (). Step 3: The random number will be generated in cell D2 which is assigned for the particular row. Drag the fill handle towards cell D11, as the random numbers are assigned to the remaining required number of rows. 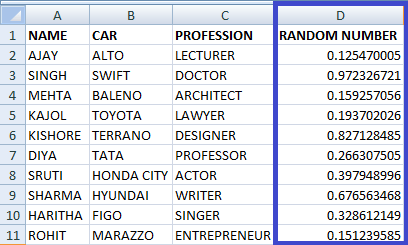
Step 4: The random number present in column C1:C11 should be sorted from largest to smallest number. Sorting in ascending order makes the column header present at the bottom of the table. Hence sorting is done in Descending order. Step 5: To sort descending, select the column D1:D11, click the Data Group, and in the Sort and Filter group, choose the ZA button. Excel automatically expands the selected row and sorts with a specified order. 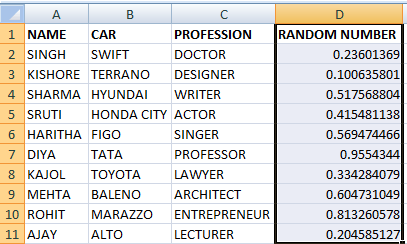
Note: If the user needs to restore the existing order of the random number, click the Sort button.Step 6: Select the required number of sample rows, and paste it into the desired location of the worksheet. 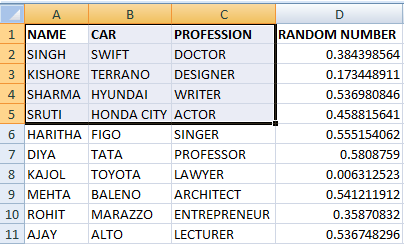
In the worksheet, row A1:C5 is selected as a sample row. SummaryIn conclusion, random values are important in statistics and data analysis. They can be generated using various methods, such as random number generators or sampling techniques. They can be used for various purposes, including simulating data, generating random samples, and assigning treatment groups to study participants. However, it is important to note that generating random values can be a complex and technical process that requires careful consideration of the research question and appropriate statistical methods. Moreover, the quality and accuracy of the random values generated depend on the quality of the random number generator or sampling technique. |
 For Videos Join Our Youtube Channel: Join Now
Feedback
- Send your Feedback to [email protected]
Help Others, Please Share


