| |

Excel Forecast FunctionForecasting or predicting the future is a great invention of modern science. Though this method is not new to this world, weather forecasting and future forecasting is a medieval age theory, but today it is more accurate. To ease the forecasting process, Microsoft Excel has introduced several functions that help the user predict linear and exponential smoothing forecasts based on different historical data, unlike sales made, specified budgets, cash flows, stock prices, etc. In this tutorial, you will discover the definition of the forecast function, its syntax, parameter, points to remember, and various real-time examples to understand how this formula works to predict a future value by using linear regression. What is Forecast Function?"The inbuilt Excel FORECAST function predicts a future value by using linear regression. In other words, the FORECAST function projects future data values along a line of best fit based on historical data." The Excel FORECAST function is introduced for linear trend forecasting. It works best for linear datasets and in circumstances when you wish to forecast a general trend neglecting trivial data fluctuations. In statistics, linear regression is defined as an approach for modelling the relationship between an independent variable (known as x) and a dependent variable (known as y values). The FORECAST function utilizes a linear regression approach to compute a y value for a specified x value based on pre-defined x and y values. In simple terms, for a specified value x, this function returns a predicted value on the basis of the linear regression relationship existing between x and y values. As an example, we can predict our website traffic for the next 7 days based on the data for the past 3 weeks. Note. The Forecast function has been replaced with FORECAST. The LINEAR function for the latest Excel versions, including Excel 2016 and above, is still accessible for backward compatibility.How FORECAST computes the future valuesThe inbuilt Excel FORECAST function predicts a future y-value by using the linear regression equation:
y = a + bx
Where the constant (intercept) values 'a' is represented by the following equation: 
And the coefficient (slope of the line) 'b' is represented by the following equation: 
The values of x? and y? represents the sample means (averages) of the existing x-values and y-values. SyntaxFORECAST (x, known_y's, known_x's) ParameterX (required) - This parameter represents a numerical value for x for which the user wish to predict a new y-value. Known_y's (required) - This argument represents an array of known dependent y-values. Known_x's (required) - This argument represents an array of known independent x-values. Excel FORECAST function not workingIf the inbuilt Excel FORECAST function throws an error, it could most likely be because of the below-given reasons:
Examples#FORECAST Example1: Using the Forecast function, predict the website traffic for the next 7 days based on the below given data for the previous 3 weeks.In the below table, we are given the data (date representing x-values and Visitors representing y-values) of the website traffic for the past 3 weeks. Predict the website traffic for the next 7 days based on the given data. 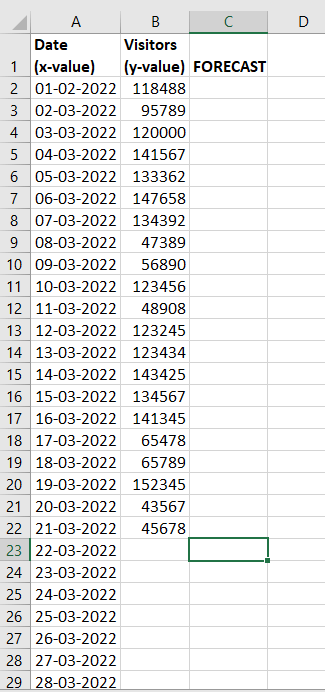
Follow the below-given steps to compute the website traffic for the next 7 days using the Excel FORECAST() function: Step 1: Introduce a helper column and select a cell to predict the website traffic Add a helper column with the name 'FORECAST' and place your cursor in the helper column infront the first date that you have to predict. In our case, we have selected cell C9 of our Excel worksheet. Refer to the given below image: 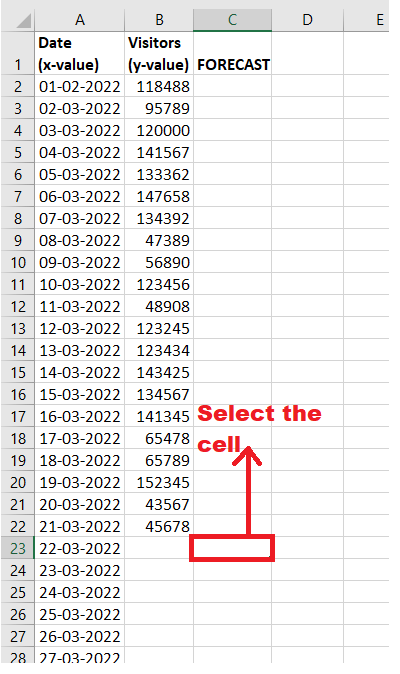
STEP 2: Enter the FORECAST function To predict the future website traffic, we will start typing the function with the equal to (=) sign followed by the built-in FORECAST function. Our formula will become: = FORECAST( 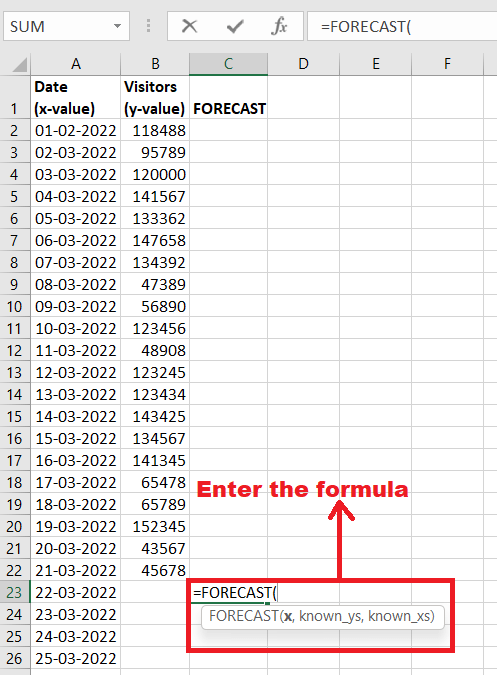
STEP 3: Insert all the parameters
NOTE: Make sure to lock the ranges with absolute cell references (like $A$2:$A$22) to prevent them from changing the cell references when replicating the FORECAST formula to other cells.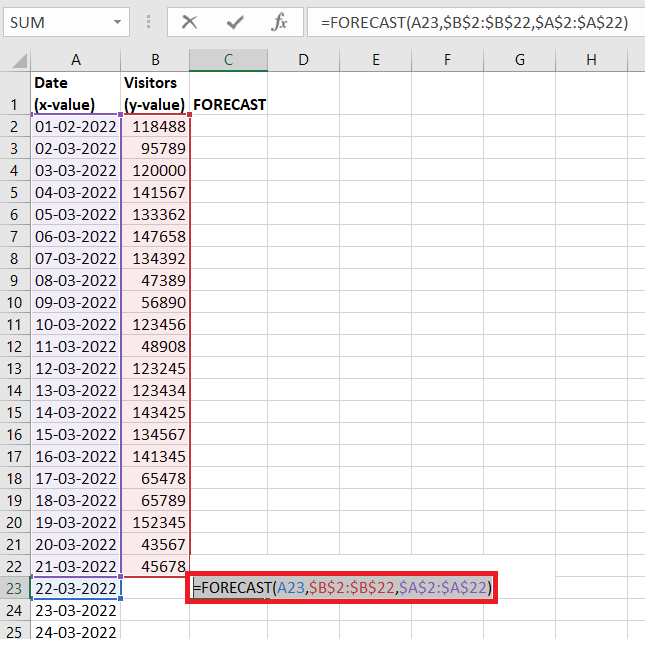
Step 4: The FORECAST function will predict the traffic output As a result, the FORECAST function will return the traffic by analysing the trends and outputs of the previous 3 weeks. 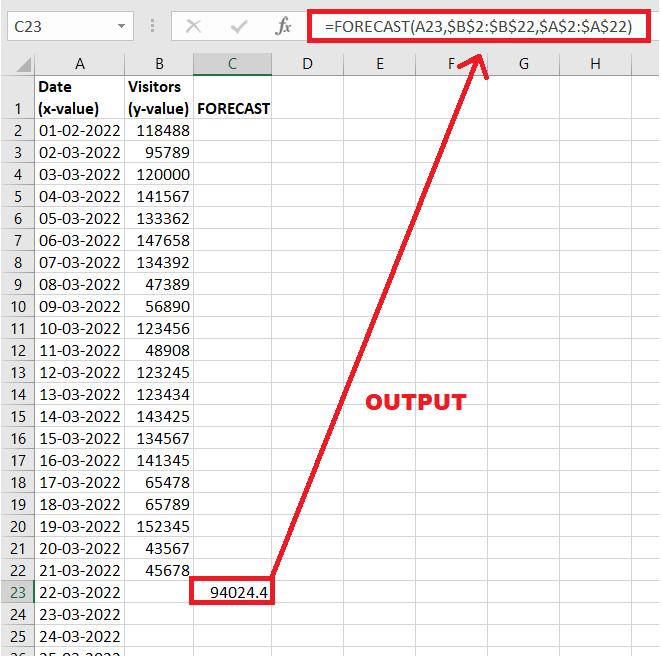
Step 5: Drag and Repeat the function to other cells Select the C23 formula cell and take the mouse pointer towards the right corner of the selected box. You will notice that towards the right side, the cursor will change into a plus (+) icon. Drag the icon to the following cells, and your surprise formula will be replicated down the cells where the absolute cell reference will be locked. It will successfully predict the traffic for the next 7 days by analyzing the linear regression pattern for the past 3 weeks. Refer to the below given output: 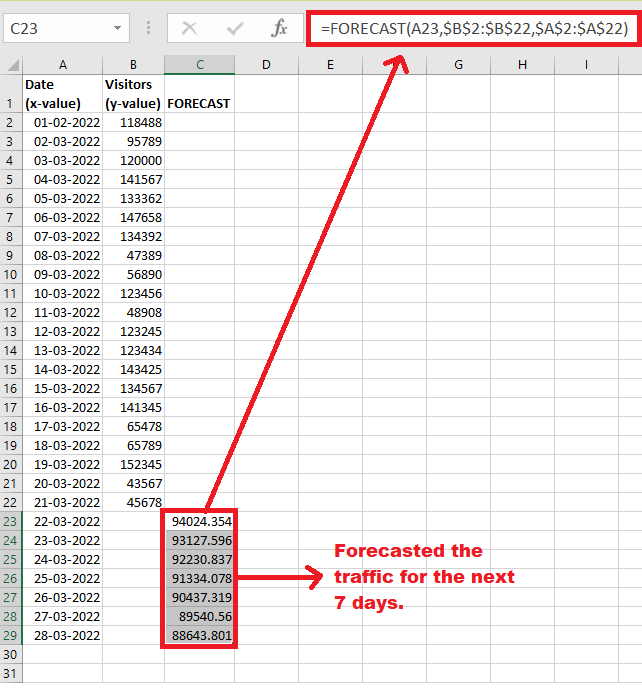
Step 6: Make a graph for predicted data Next, we will display the output using a graph. Select the data, go to insert-> charts-> line charts. Excel will create a detailed linear regression forecasting chart. Refer to the below output. =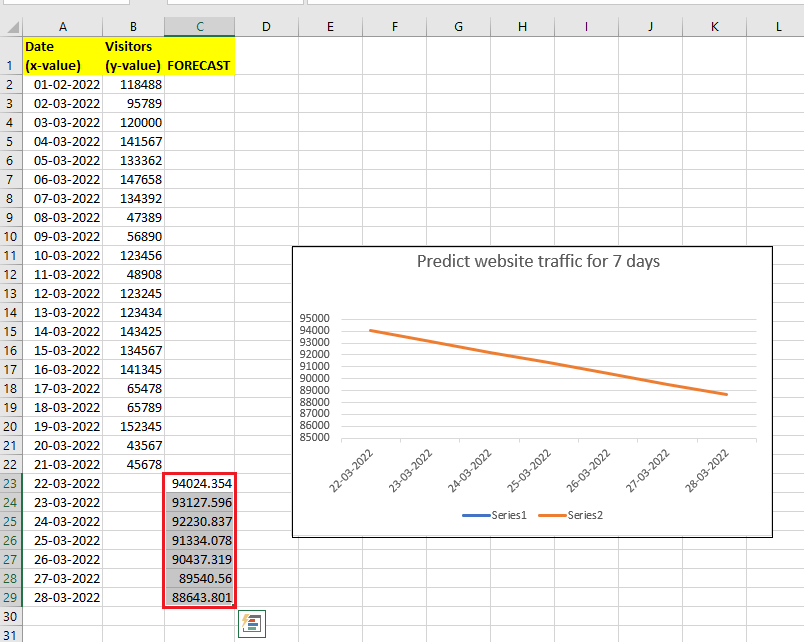
NOTE: If you'd like to predict future values based on the recurring pattern observed in your historical data, implement the inbuilt FORECAST.ETS instead of the Excel FORECAST function.So, using the inbuilt Excel FORECAST function in excel above, we successfully forecasted the future traffic of our website for the next 7 days. #Forecast Example 2: Calculate the future value if the x parameter contains non-numeric value.The FORECAST function returns the #VALUE! error if the specified x value is non-numeric. Let's understand this using the below given data. 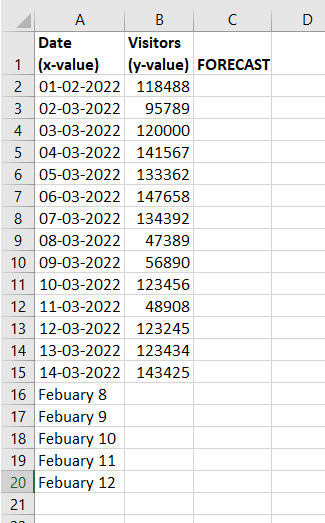
As you can see in the above data, we are given x value and y-value for 14 days. Based on the existing values, we have to compute the Visitors for the next 5 days but with a bit of twist. In this example, the next 5 days are non-numeric. Follow the below-given steps to analyze the output if we specify non-numeric data in the x value argument of the FORECAST() function: Step 1: Select a cell to predict the confidence interval for a forecasted value Place your mouse cursor below your data set so you can compute the forecasted value for the given data. In our case, we have selected cell C16 of our Excel worksheet. Refer to the given below image: 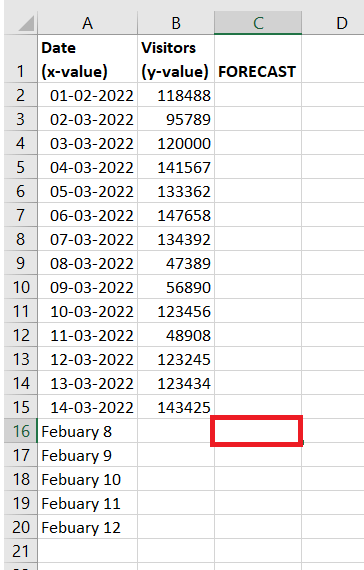
STEP 2: Enter the FORECAST function To calculate the depreciation value, we will start typing the function with the equal to (=) sign followed by the built-in FORECAST function. Our formula will become: = FORECAST( 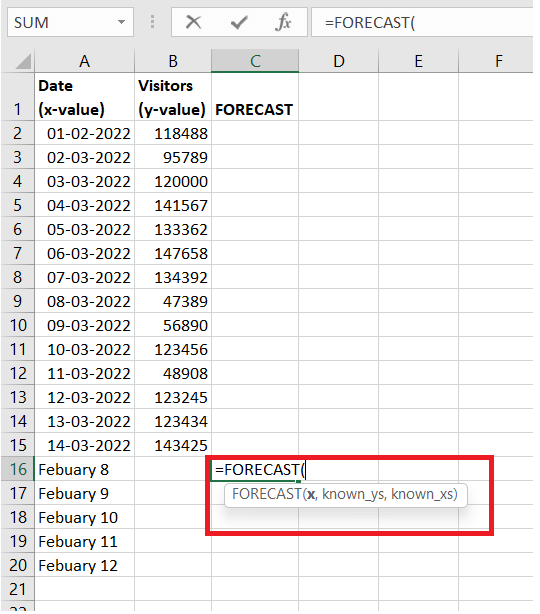
STEP 3: Insert all the parameters
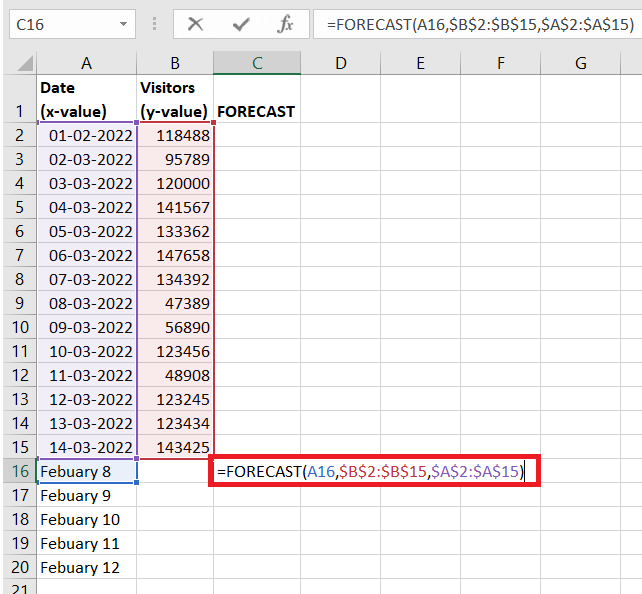
NOTE: Make sure to lock the ranges with absolute cell references (like $A$2:$A$15) to prevent them from changing the cell references when replicating the FORECAST formula to other cells.Step 4: The FORECAST function will predict the traffic output As a result, the FORECAST function will throw the #VALUE! Error because we have specified a non-numeric value in the x -value parameter. Refer to the below output. 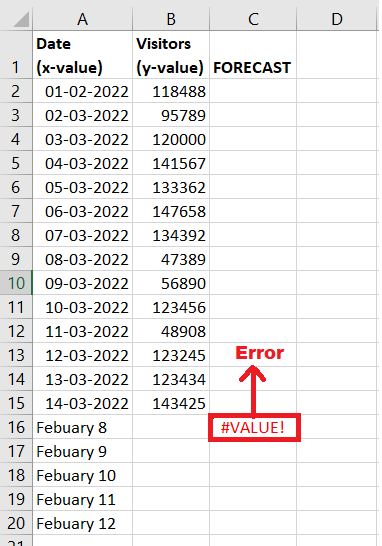
Next TopicExcel IFS Function
|
 For Videos Join Our Youtube Channel: Join Now
Feedback
- Send your Feedback to [email protected]
Help Others, Please Share


